Puffer
 Bitcoin
 ZKsync
 NEAR Protocol
 Walrus
 Pearl
Pearl Ondo
Ondo
- AAVE created a bullish pennant pattern, indicating an impending breakout.
- Analysts predict a rise toward $220 on the successful breakout.
- AAVE price traded above the 100-day and 200-day EMA region.
AAVE, the native token of the decentralized lending platform, has formed a bullish pennant formation. It anticipates a breakout ahead.
Since hitting a 52-week high mark of around $180, the AAVE price has continued to retrace over the past few weeks. The token has retested the 61.8% Fib retracement zone. Meanwhile, the recent price action hinted that buyers have started accumulating AAVE crypto and are hoping for a rise.
Despite forming the lower low sequences, the uptrend was intact. Also, the AAVE price may cross the 52-week high cluster and hit the $200 mark this month.
A significant upside will unlock if the AAVE crypto price succeeds in climbing above the 20-day EMA mark. This could send AAVE to retest the $180 hurdle.
In yesterday’s session, a bearish, engulfing candlestick was noted. A rejection from the $150 mark was noted. This implied that the bear cartel was still active and tried to prevent itself from being defeated.
AAVE Poised for Bullish Breakout, Analyst Suggests
In his recent tweet, Crypto Analyst World of Chart highlighted that AAVE crypto has formed a bullish pennant formation.
A bullish pennant pattern was formed. This happened when a solid upward price movement followed a retracement that resembled a small symmetrical triangle. This pattern suggested that the buyers are temporarily pausing before continuing the uptrend.
$Aave#Aave Now Testing Bullish Pennant Trendline Resistance As Expected Incase Of Successful Breakout Aave Can Surpass 200$ Easily In Coming Days https://t.co/DBOT5El9jv pic.twitter.com/upJ5Dii6CQ
— World Of Charts (@WorldOfCharts1) October 30, 2024
He added that if the AAVE price crosses the trendline hurdle of $170, a bullish wave toward $200 can be anticipated. Additionally, he believes that if the breakout comes to full fruition, it could hit $220 next.
At press time, the AAVE price was trading at $142.31. The token noted an intraday decline of over 7.20%.
What Does AAVE Crypto Price Action Indicate?
The daily timeframe analysis of AAVE crypto conveyed a short-term price retracement. However, the long-term uptrend was intact. Also, a break above the $170 mark could resume the bullish wave to capture the $200 mark next.
The Relative Strength Index (RSI) line was close to the midline region. That signaled a neutral outlook and a weak buying momentum throughout the week.
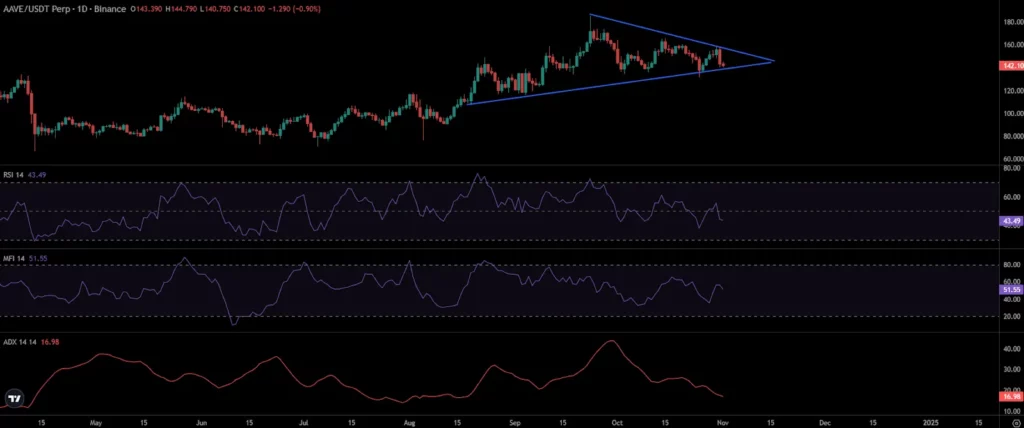
However, the Money Flow Index (MFI) line was nearly 50. This meant that the significant liquidity was entering the market.
Meanwhile, the Average Directional Index (ADX), which measures the trend’s strength, was below 25. That signaled a lack of bullish momentum.
Total Value Locked (TVL) Witnessed a Whopping Surge
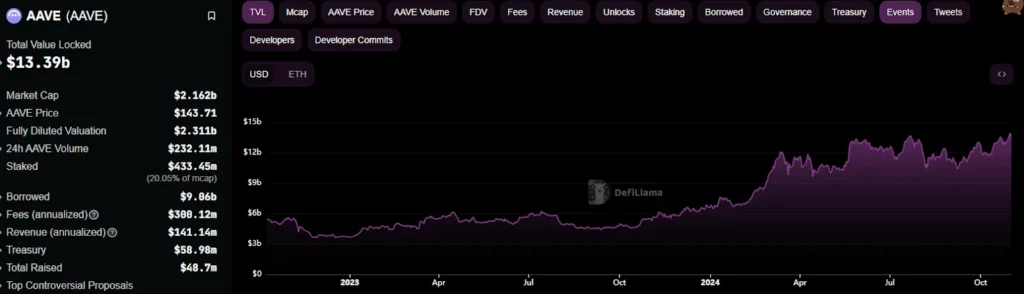
Since 2023, AAVE’s Total Value Locked has continued to rise and reached its peak. At press time, it noted a peak of around $13.39 Billion. This significant upsurge in TVL indicated the persistent growth in the ecosystem.
Also, it implied a heightened investor interest and significant demand among the market participants.
The Open Interest (OI) dropped over 1.20% to $110.78 Million. This conveyed a decline in long contracts over the past 24 hours.
The immediate support zones for AAVE were $138 and $130. At the same time, the upside hurdles were $165 and $175.
Disclaimer
In this article, the views, and opinions stated by the author, or any people named are for informational purposes only, and they don’t establish the investment, financial, or any other advice. Trading or investing in cryptocurrency assets comes with a risk of financial loss.