
 Dacity Coin
 astronaut
 streamoors
 Celestia
 NeoSoul
 Sui
Sui Injective
- ETH’s exchange reserves dropped significantly as whales held tight.
- The consistent surge in short liquidations could drive the ETH prices higher shortly.
After breaking out of the falling channel pattern in the first week of November, Ethereum (ETH) continued to trade in an uptrend. Following a golden crossover of the 20-day EMA and 50-day EMA, Ethereum’s bulls have continued to accumulate and build a bullish momentum.
In the last three sessions, the Ethereum price registered an 8.25% increase. Furthermore, the token rebounded from the 20-day EMA mark. If the bullish streak continues, ETH price may see a breakout above the $4k barrier and could hit the All-Time-High mark soon.
At press time, the price of Ethereum traded at $3925, noting an intraday rise of over 0.87%. Alongside the price rise, the trading volume surged over 12%, which favors the bullish outlook. It has a market cap of $472.82 Billion, and the total supply stood at 120.44 Million.
Ethereum’s Bullish Potential: Here’s What Analysts Say
A recent tweet by Mags highlighted that the Ethereum price had retested the $4000 horizontal neckline multiple times. Furthermore, it was ready to register a sharp upsurge in the coming sessions.
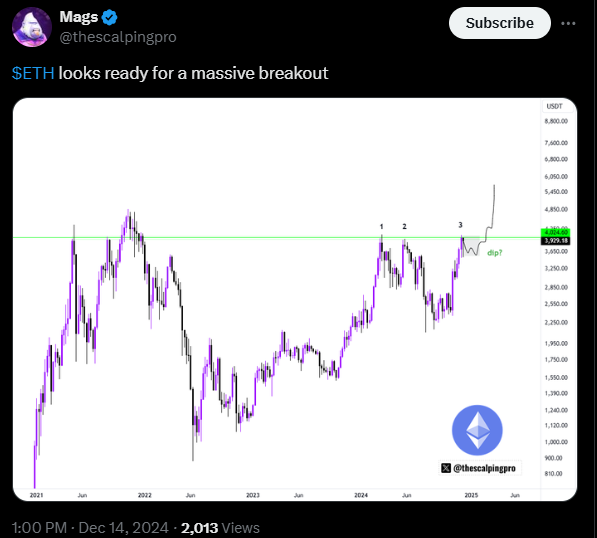
In case of a successful breakout, it could strike the ATH level. Moreover, KALEO was guiding a strong, bullish commentary on ETH.
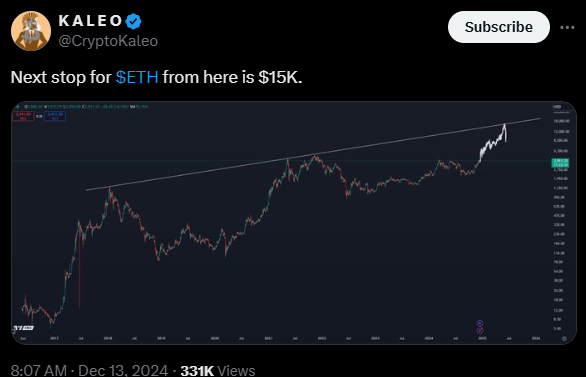
He said that ETH was reversed from the lower trendline of the rising channel, and it was going higher. The next stop for Ethereum, as per therising channel’s lower trendline andTH Exchanges Reserves Keep Falling: Bullish Signal Ahead?
ETH Exchanges Reserves Keep Falling: Bullish Signal Ahead?
Data from CryptoQuant showed that the Ethereum’s exchange reserve has continued to drop. It has been in a downtrend. The reserve has fallen to approximately 19.23 million, suggesting a reduction in the liquidity available on exchanges.
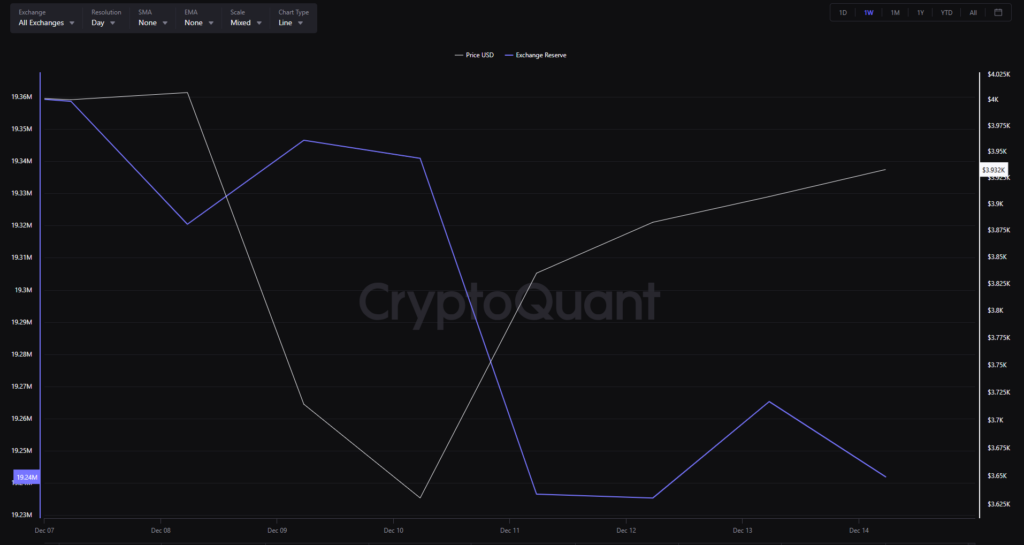
This drop in liquidity can be a positive sign for Ethereum, as fewer holders are looking to sell their ETH. The move reduces the selling pressure, thus helping the bulls to cross the $4K resistance mark.
A continued downtrend in the exchange reserves metric signaled a bullish sentiment. This implied that accumulation and reduced selling pressure could fuel a further price rally.
Moreover, the constant contraction of exchange reserves can be attributed to long-term holders (HODLers). This sentiment indicated investors’ strong belief about Ethereum’s future price.
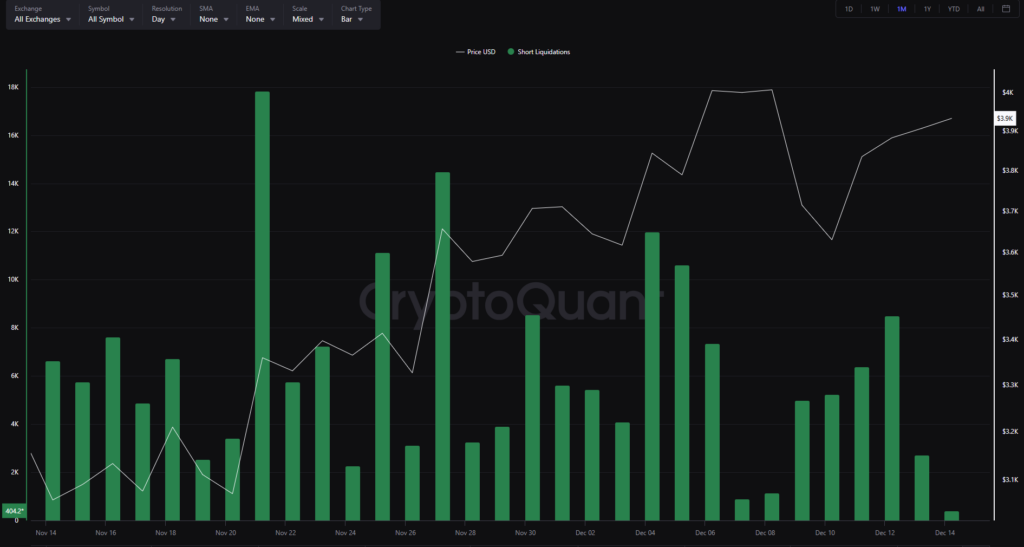
A look at the short liquidations over the past seven days showed a significant surge. CryptoQuant data showed that it was worth over 25k ETH. These liquidations, once triggered, open market buy orders, which would fuel the Ethereum price rally.
Ethereum Price Prediction: Key Indicators Explained
The Ethereum price chart revealed several bullish signals reinforcing the potential for sustained upward momentum. It has maintained bullishness around the $4K supply zone. Furthermore, it has shown solid support around the $3300 mark close to the 20-day EMA.
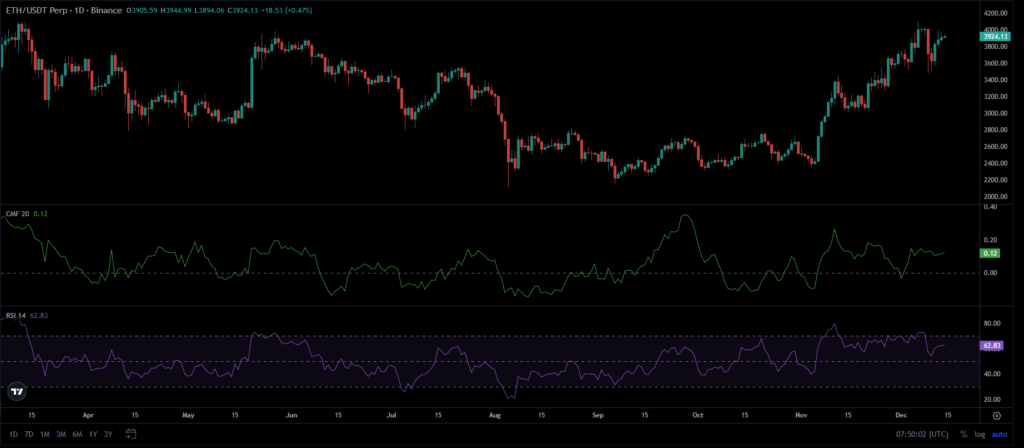
Moreover, the Chaikin Money Flow (CMF) read a positive at 0.12. That meant strong buying interest. ETH’s Relative Strength Index (RSI) had a reading of 62. It signaled significant room for upside, and displayed a bullish outlook.
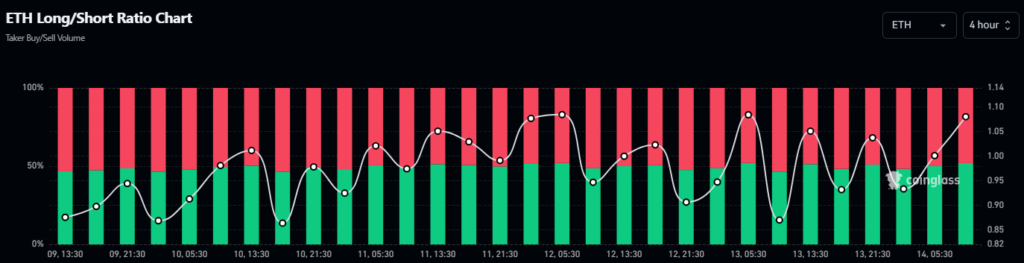
Ethereum’s Long/Short ratio indicated a notable rise in the long positions compared to the short positions. This reflected that market participants are increasingly bullish on ETH.
The immediate support zones were $3600 and $3300. At the same time, the resistance zones were $4280 and $4500.
Disclaimer
This article is for informational purposes only and provides no financial, investment, or other advice. The author or any people mentioned in this article are not responsible for any financial loss that may occur from investing in or trading. Please do your research before making any financial decisions.




