
 Dacity Coin
 streamoors
 Pudgy Penguins
 Injective
 Celestia
 Sui
Sui Pearl
Pearl
- Dogecoin price has been struggling in a narrow range for the past 5 days.
- Dogecoin price has declined by 23% in a week.
The Dogecoin (DOGE) price chart has witnessed a gain of 400% since September. However, it has failed to hold, and decent profit booking momentum has been observed.
Since mid-November, the momentum slowed down and continued for a month. In mid-December, the DOGE price witnessed sharp selling pressure by losing 20-day EMA.
The price has been rising through an ascending channel on a weekly time frame. It was in the higher low territory at press time, and a bullish rally is anticipated. This scenario was observed in 2017, and a giant bull run was seen. Analysts suggest a bullish rally from the higher low zone.
Is It Time to Repeat History For Dogecoin?
Ali, a crypto analyst, believes that the Dogecoin crypto is ready to repeat history. This analysis is based on the weekly time frame. According to this tweet, the Dogecoin price surged by 212% in 2017 and retraced 40%. After this retracement, the token has climbed by 5,000%.
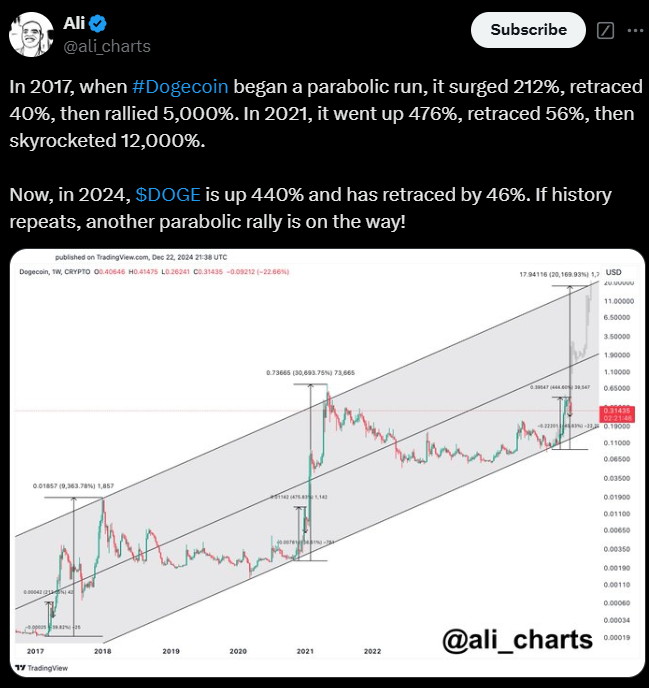
Moreover, the DOGE price has advanced by 476% and experienced a retracement of 56%. After its retracement, it has displayed a massive gain of 12,000%.
Similarly, the price has climbed by 440% and displayed a 46% correction. As per history, the Dogecoin might witness another bullish rally.
DOGE Price Overview: Can Bulls Survive This Dip?
When writing, the Dogecoin price was trading at $0.322. That has slightly dropped in the past 24 hours. The market capitalization was $47.50 Billion, and the 24-hour trading volume was $3.53 Billion.
Amid this sharp fall, the DOGE price has dropped to the support level of $0.300 and has halted. From the buyers’ perspective, this dip could be a buying opportunity by seeing the token at a discount. Here, sellers might try to dominate and drag the price below the $0.300 level.
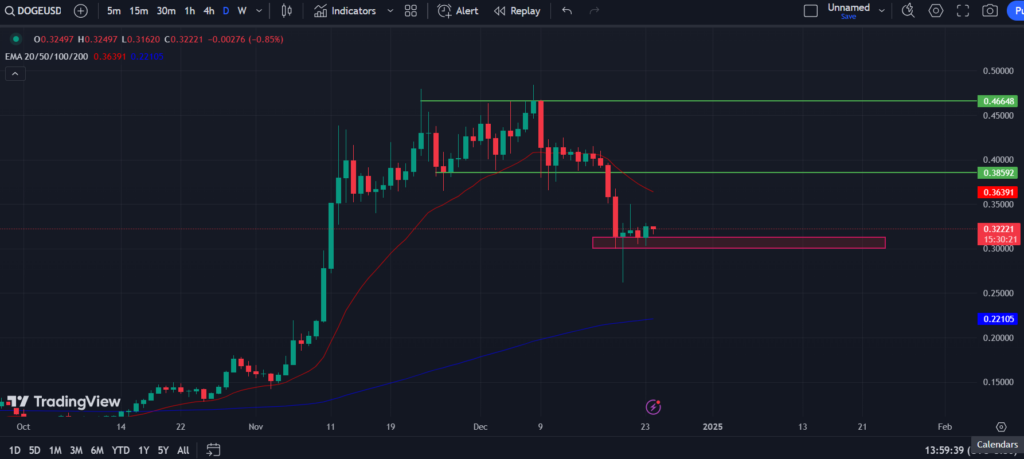
Suppose the Dogecoin price defends the support level of $0.300; it could attract buyers. Any bullish candlestick pattern on this support level could initiate a bullish trend.
Once the price starts trading over the 20-day EMA, the price may display a bullish rally. Moving ahead, the token could eye for a new all-time high.
Conversely, buyers might panic if the DOGE price slips below the $0.300 level. Based on this scenario, panic selling can be generated, which may lead to strong selling pressure.
After a small bearish momentum, the price may melt to the 200-day EMA. If the price loses the 200-day EMA, it could be tough for sellers to bounce back.
Dogecoin Price Historical Charts and Analysis
Dogecoin stood at a critical juncture as it faced significant resistance and support levels. After experiencing a decline over the past week, the DOGE price has stabilized around the support level of $0.300.
Analysts suggest that the Dogecoin price may defend this support. If this happens, it may set the stage for a bullish rally reminiscent of its past performance during previous market cycles.
The historical patterns indicate the potential for a substantial price movement if buying interest returns. However, if Dogecoin fails to hold above this key level, it risks triggering panic selling, which could lead to further declines.
Disclaimer
This article is for informational purposes only and provides no financial, investment, or other advice. The author or any people mentioned in this article are not responsible for any financial loss that may occur from investing in or trading. Please do your research before making any financial decisions.




