
 Dacity Coin
 NEAR Protocol
 Quantus
 Bitcoin
 Celestia
 Pearl
Pearl Pudgy Penguins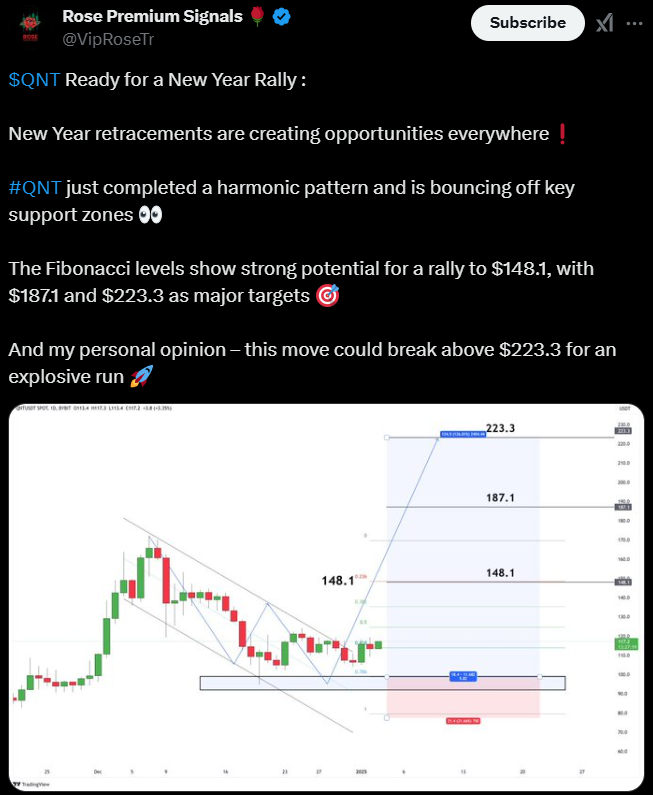
- Quant price has formed a double bottom pattern at support and reacted positively.
- QNT price has triggered a breakout from a falling channel.
Since November, the Quant (QNT) crypto has been bullish and advanced by 190% until the first week of December. However, this bullish trend was disturbed near the $170 mark and witnessed a good fall.
In December, the Quant price kept falling through a descending channel and took support at the $100 level. While taking support, Quant crypto has formed a double bottom pattern and shown elevation.
As per the chart structure, the price has triggered a breakout from the descending channel and exceeded the 20-day EMA. Some experts have set their target for the upcoming bull run.
Could Quant Crypto Hit the $200 Mark?
Rose Premium Signals, a crypto analyst, believes the Quant crypto has the potential for a bullish move. Most cryptocurrencies are witnessing opportunities due to the retracement of the new year.
The Quant price chart has completed a harmonic pattern on a daily time frame and triggered a breakout. Furthermore, the price has departed from the support zone, showcasing bulls’ involvement.
After this successful breakout, the price is expected to reach its first target of $148.1. If buyers remain strong, the price might hit the $187.1 and $223.3 targets, respectively. If the chart structure attracts investors, the price might enter the $200 territory.
Quant Price Overview and Its Forecast
Quant crypto was trading at $119.41 at the time of writing and has declined by 1.16% in an intraday session. The market capitalization was $1.44 Billion, and the 24-hour trading volume was $25.92. Furthermore, the Buying momentum could be observed.
Suppose the Quant price is sustained over the 20-day EMA post that is observed. Based on the chart structure, the price is expected to cover recent losses after a successful breakout.
Amid this bull run, if sellers stay out of the race, the QNT crypto price could extend to the $200 mark.
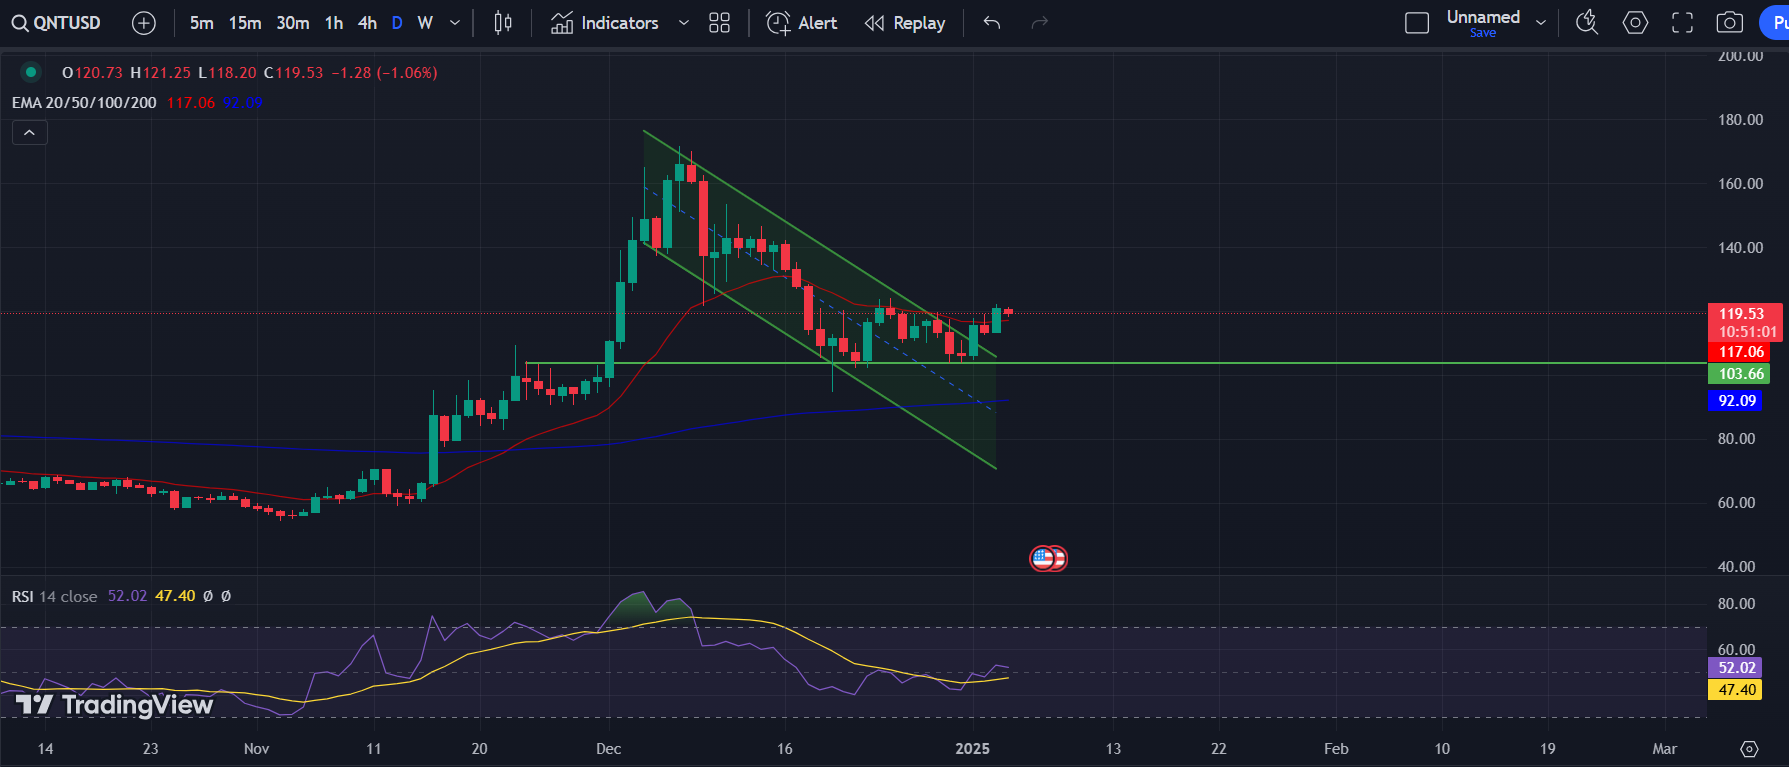
Alternatively, if the price dives below the major support level of $100, it could be a selling opportunity. Once the Quant crypto sustains below the 200-day EMA, it might keep melting. In this scenario, profit booking momentum can be generated.
The MACD and the Signal line have come close to the Zero line, and the histograms have turned green. RSI has triggered a golden crossover with the RSI-based moving average. It has displayed a slight bullish divergence. That showcased the bullish forecast.
QNT Price Analysis Based on Chart Structure
The Quant price has demonstrated promising signs of a potential bullish move. It followed the formation of a double bottom pattern and a breakout from a descending channel.
Analysts are optimistic about its trajectory, with Quant Crypto currently trading at around $119.41. They anticipated the token could reach targets of $148.1 and $187.1. It could even touch the $223.3 mark, provided buying momentum continues and the price remains above the 20-day EMA.
However, caution is advised. If the price falls below the critical support level of $100, it may indicate a bearish sentiment. That could lead to potential profit-taking.
Overall, indicators such as the MACD and RSI suggest a bullish outlook. This set the stage for possible upward movement shortly.
Disclaimer
This article is for informational purposes only and provides no financial, investment, or other advice. The author or any people mentioned in this article are not responsible for any financial loss that may occur from investing in or trading. Please do your research before making any financial decisions.




