
 Bitcoin
 ZKsync
 Pudgy Penguins
 Pearl
Pearl Quantus
 Starknet
 NEAR Protocol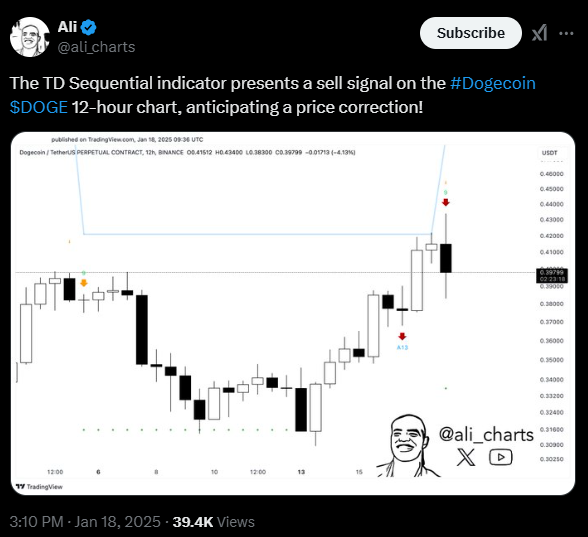
- A whale dumped 30,000,000 DOGE on Binance in the past few hours.
- A possible fall is indicated by the TD Sequential indicator flashing a sell signal.
Dogecoin (DOGE) has gained significant attention after flashing a sell signal on its 12-hour chart. That hinted caution for a potential decline.
However, with the Bitcoin price surpassing the $105K mark, other meme coins and altcoins also participated in the rally. Meanwhile, the Dogecoin price was still trying to negate the selling pressure and struggling to move past the $0.4000 mark.
At press time, the Dogecoin price was trading at $0.3991. Furthermore, the token noted an intraday rise of over 0.56% in the past 24 hours.
In the past seven days, the DOGE price has rallied over 16% and showed a strong comeback from the lower levels. Its market cap stood at $58.83 Billion, ranking 7th in the overall crypto market.
Warning Signs for DOGE: TD Sequential Points To a Decline
In a recent post on X, Ali Martinez highlighted that the DOGE price might need a significant correction. He made this prediction based on the signal by the TD Sequential indicator.
The TD Sequential indicator flashes a sell signal per the observation, suggesting that the Dogecoin price may face a retracement shortly. A “9” sell signal has emerged, indicating the upward movement has been reversed.
Traders and investors often use this signal as an early indicator to reassess their positions. Additionally, the DOGE price was still struggling to sustain above the $0.4000 mark and showed signs of rejection.
Whale Dumps $36 Million Worth of DOGE
Besides the sell signal by the TD Sequential indicator, another activity signals a caution. Per an X post by Whale Alert, a whale had dumped to Binance a substantial 90,000,000 DOGE, or $36.438M.
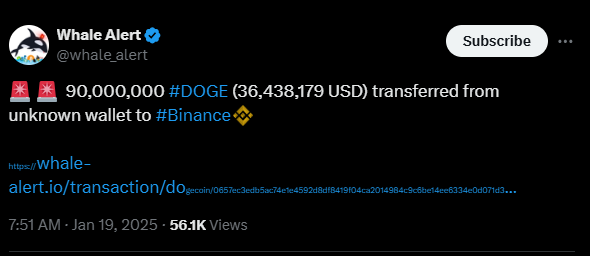
This significant deposit raises concerns about a potential selloff. The concern became more critical as the Dogecoin price faced resistance around $0.4000 and braces for a retracement.
On-Chain Metrics Signals Caution
DOGE’s Sharpe Ratio chart from Messari highlighted that there could be a potential decline ahead. The 90-D Sharpe Ratio was around 3.92, implying a risk, as it was considerably higher.
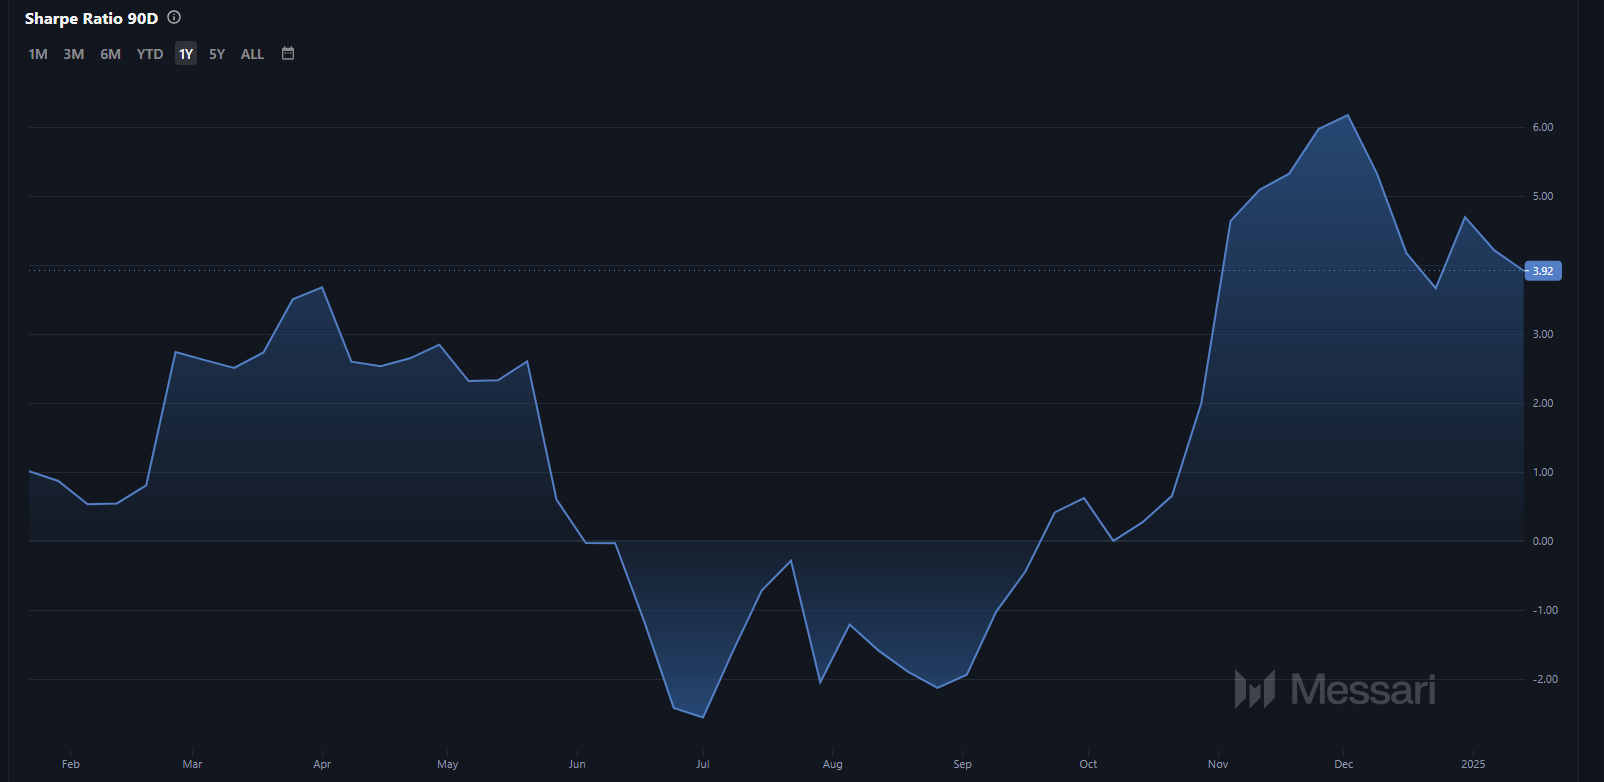
Notably, it implies that the DOGE price was at a higher zone and signals downside risk ahead. It has been outperforming for the past few weeks, and the ratio has increased. However, a decline could take place and might curtail the upward momentum.
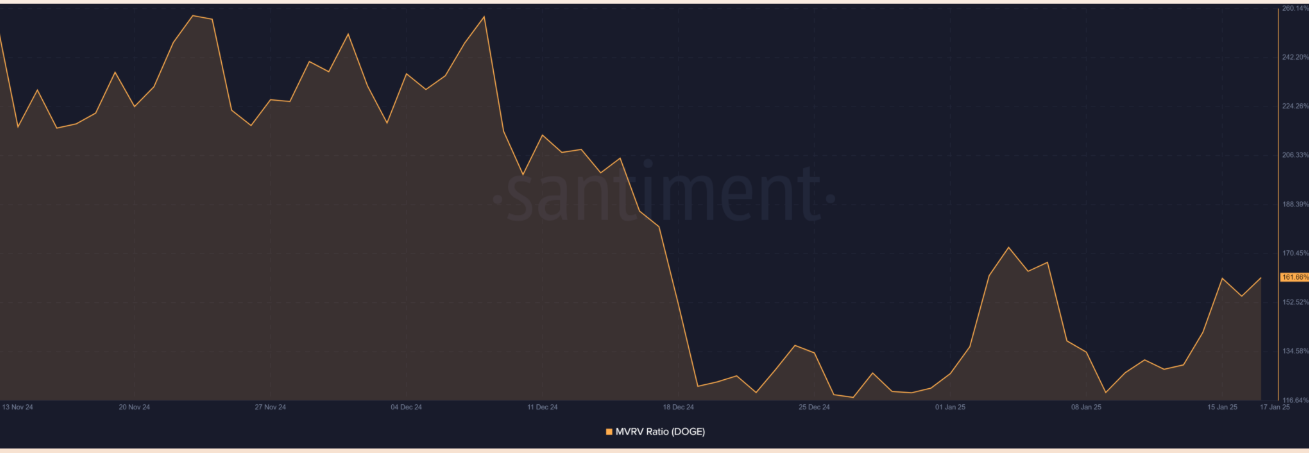
Similarly, the MVRV Ratio was around 160%, indicating that DOGE holders were sitting on significant profits. Moreover, this could lead to a potential selloff. With whales offloading their holdings and bearish signals shown by indicators, investors need to be alert in the coming days.
Dogecoin Price Analysis: Levels That Could Define the Trend
Per the daily chart analysis, the Dogecoin price has exceeded the key moving averages. It was attempting for an upward push. Fueled by broader market bullish sentiment, DOGE seemed to break the crucial hurdle of $0.4500 to invalidate the bearish projection.
Once it clears the $0.4500, it could accelerate ahead. The token may target the previous month’s high of $0.4800 in the coming days. However, if the immediate support zone of $0.3600 was breached, a decline toward $0.3200 and $0.3000 could be seen.
Disclaimer
This article is for informational purposes only and provides no financial, investment, or other advice. The author or any people mentioned in this article are not responsible for any financial loss that may occur from investing in or trading. Please do your research before making any financial decisions.




