Dacity Coin
 astronaut
 streamoors
 Celestia
 NeoSoul
 Sui
Sui Injective
- Avalanche has broken down from a symmetrical triangle, targeting the lower $20 support level.
- Large transactions for AVAX decline, signaling reduced institutional interest.
- Avalanche’s market value ratio suggests the asset may be overvalued.
Avalanche (AVAX) recently broke down from a symmetrical triangle pattern, signaling a potential price drop towards the $20 support level. Despite increasing network activity, a decline in large transactions and a high market value ratio suggest bearish momentum.
Avalanche Breaks Symmetrical Triangle, Bearish Momentum Ahead
Avalanche (AVAX) broke down from a symmetrical triangle pattern, which indicated that its price may fall towards $20. A downward breakout confirmed the indecision between bulls and bears that usually forms inside symmetrical triangle patterns.
Analysis from Ali_Charts shows AVAX moving in a triangular pattern between $27 and $29 before dropping sharply below $27, thus indicating the start of possibly decreasing trends.
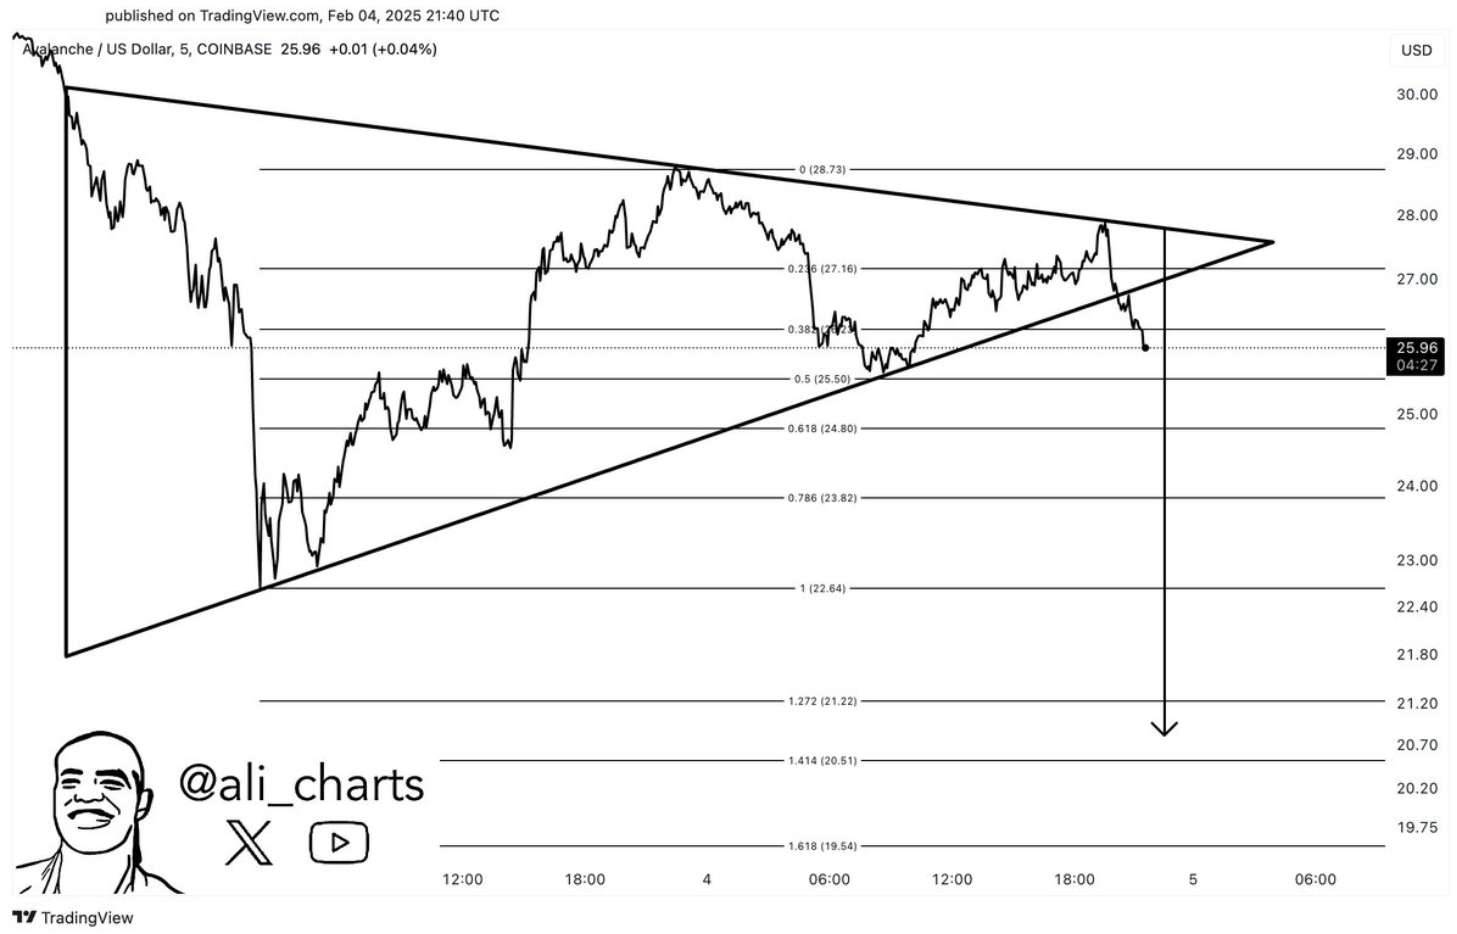
The analysis shows the support area is located approximately at $20 following the breakdown of the trend. Under such circumstances, AVAX shows potential for additional decrease.
Large Transactions Decline, Indicating a Shift in Market Sentiment
The quantity of substantial AVAX transactions experienced substantial reduction throughout recent weeks. The recorded number of large transactions followed a decreasing pattern starting from the December 2023 high up to the January 2024 low.
The token experienced 505 large transactions on February 3, 2025 yet this number stood lower than the 1.19k transactions recorded only a few days prior.
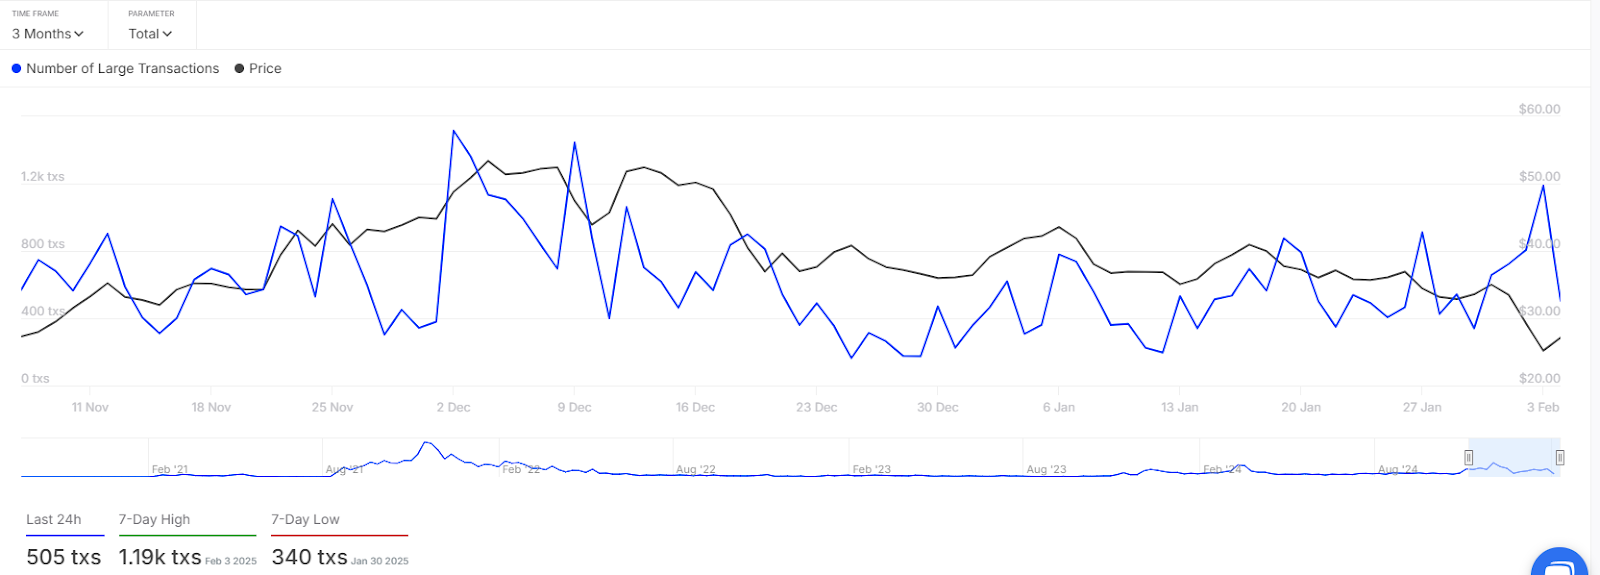
The decrease of major transaction volume suggests institutions may be less interested in the market, which seems related to the price decline.
Market liquidity has the potential to decrease because fewer large transactions occur in the market, thus leading to volatility increases. The current price behavior of investors with AVAX assets indicates they are pulling their assets out of the market, probably leading to bigger value fluctuations.
Market Value Ratio and Active Addresses Show Mixed Signals
The behavior of the AVAX price in the market presents problems but underlying network activity appears to display conflicting data.
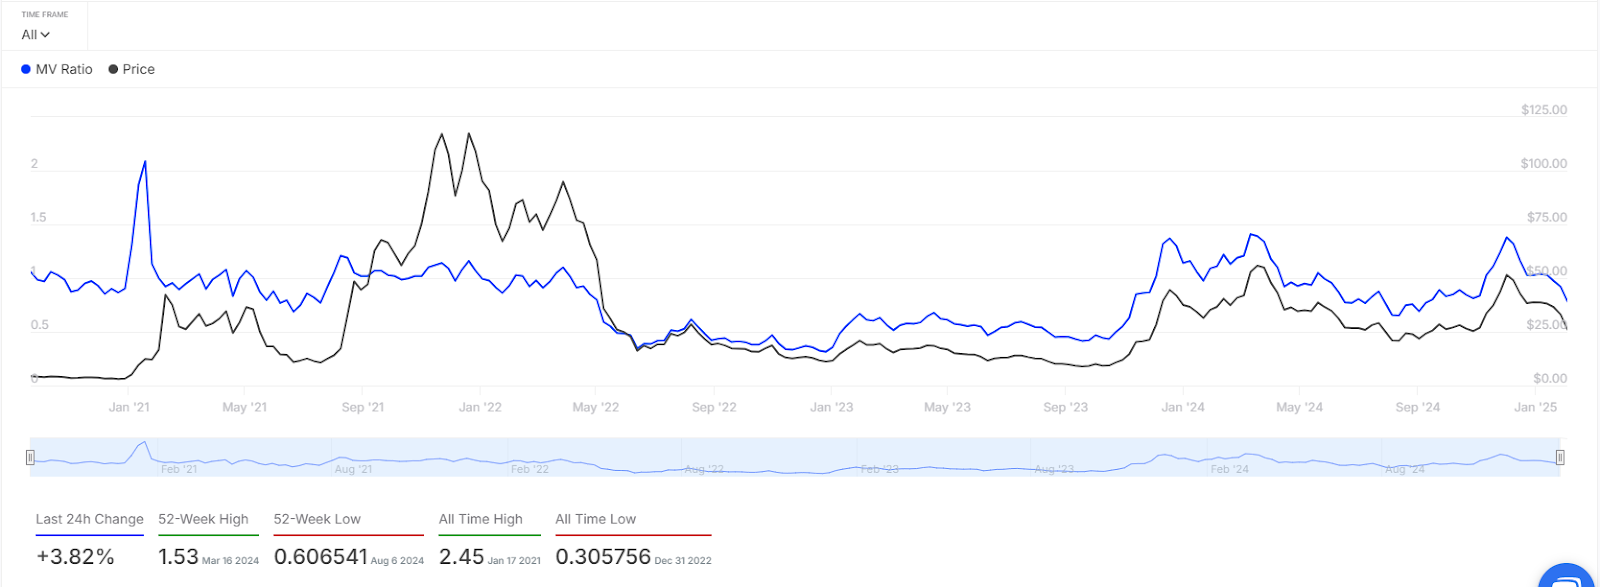
The Market Value to Realized Value (MV Ratio) illustrates an excessive doubling of the MV ratio, which implies AVAX’s current value exceeds its real market worth, thus validating bearish future trends.
A market correction seems probable according to the MV ratio metric that achieved its highest point at 1.53.
However, a sharp growth appears in the tracked active addresses as the price experiences downward pressure. The number of active Avalanche addresses reached a new record of 480,000 records per day in January 2025 during a substantial market growth period.
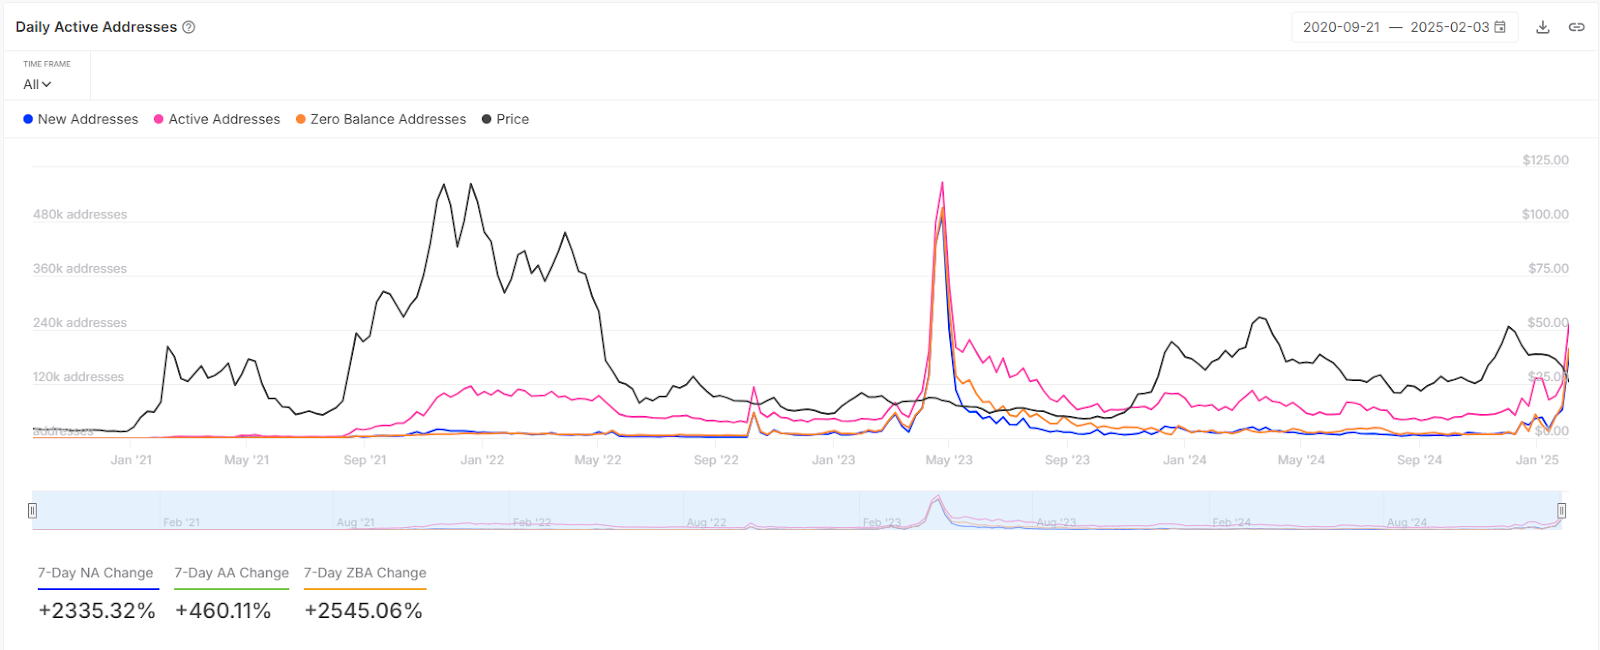
Strong network activity and user interest in Avalanche’s technology platforms are apparent from its growing active user base.
Bollinger Bands Consolidation Ahead?
The 4-hour price chart shows Bollinger Bands on AVAX providing indications of increased market volatility. The latest price drop beneath the lower band indicates a possible market correction.
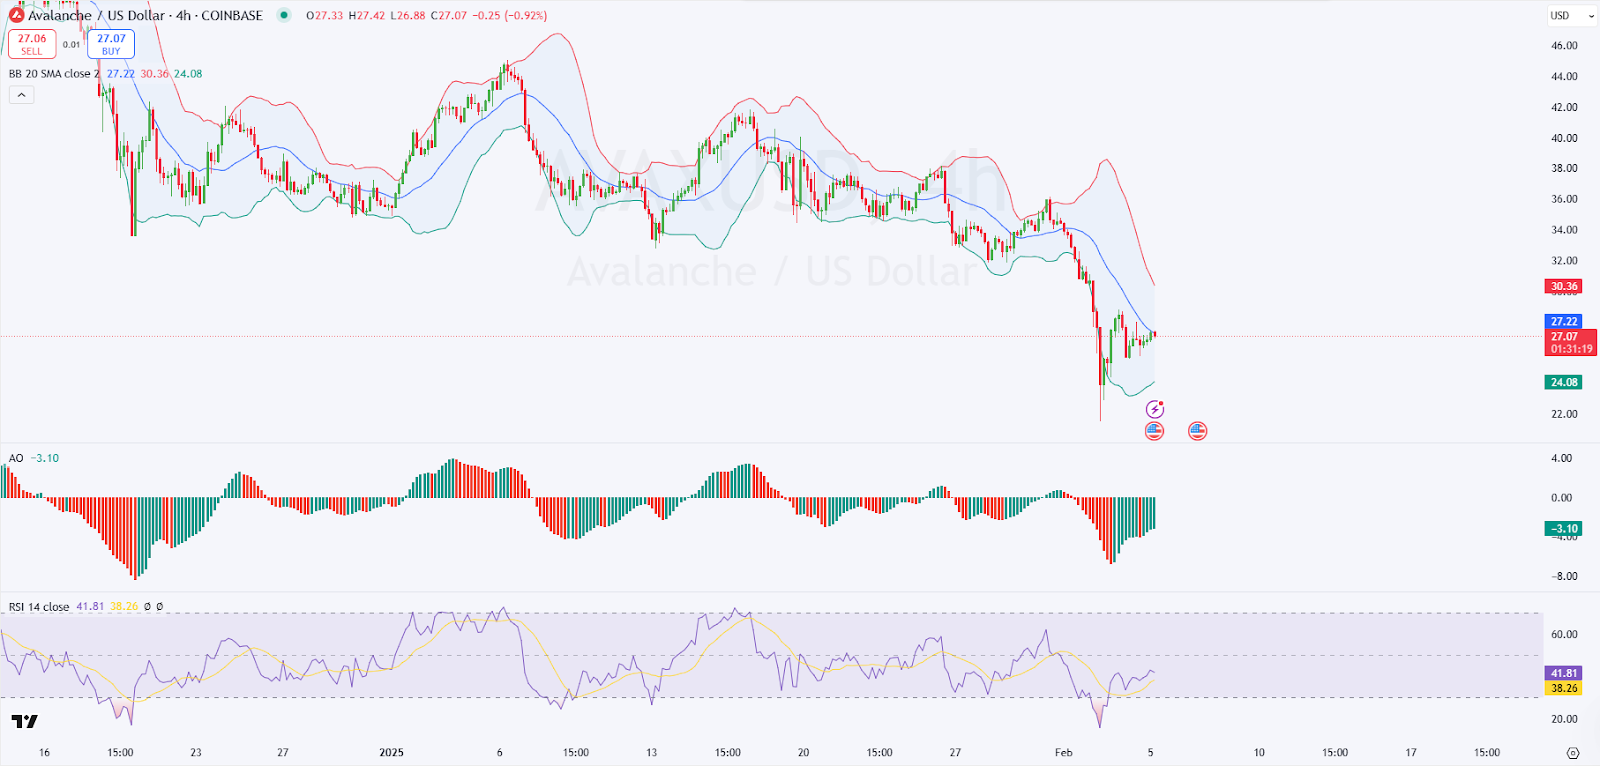
Current market analysis shows the token is trading at $27.06 while its upper band sets at $30.36 and lower band stands at $24.08. The support and resistance bands surrounding the asset provide crucial levels for price control and a sustained downward movement would be confirmed when the price breaks below its lower boundary.
The Awesome Oscillator displays negative readings, which add strength to the bearish price trend outlook.
Currently the Relative Strength Index supports AVAX at 41.81, showing a price position neither overbought nor oversold, while more price drops might create an oversold condition, which could be a buy opportunity for traders
Disclaimer
This article is for informational purposes only and provides no financial, investment, or other advice. The author or any people mentioned in this article are not responsible for any financial loss that may occur from investing in or trading. Please do your research before making any financial decisions.