
 Puffer
 ZKsync
 Bitcoin
 NEAR Protocol
 Pearl
Pearl Quantus
 Sui
Sui

Key Insights:
- XRP’s MVRV Ratio below the 200-day MA signals possible downside.
- 39M XRP whale transaction worth $85M indicates rising interest.
- Whale accumulation could signal a bullish rally for XRP.
XRP price on-chain metrics are sending mixed signals as the asset navigates a key support zone. While the MVRV ratio dipped below its 200-day moving average—a bearish flag—whale accumulation suggests some investors are betting on a longer-term upside.
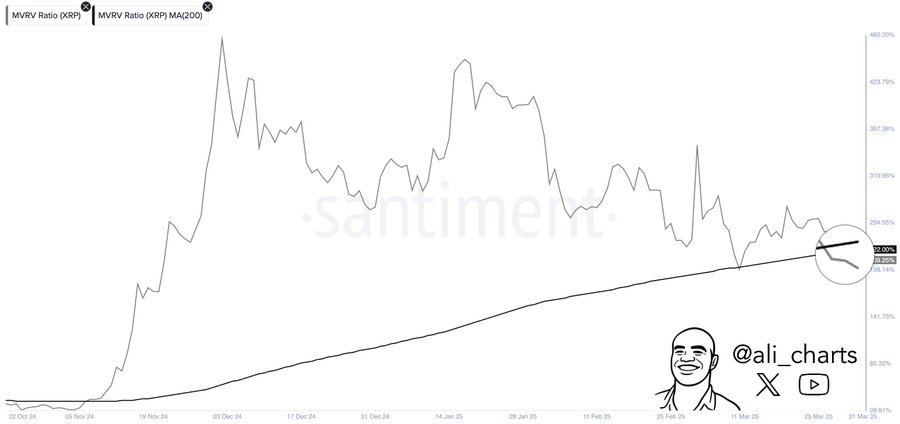
The dip could be interpreted as a bearish signal, indicating that XRP’s market value is now lower than its realized value. This trend often leads to price corrections or periods of consolidation. However, it’s important to note that the market is still in a highly dynamic state, and further price movement depends on various factors.
Whale Activity Signals Growing Institutional Interest
This bearish technical signal on the MVRV ratio fails to make much of an impact on large investors also known as whales that keep on accumulating XRP. Recently, this whale purchased an outrageous 39 million XRP worth approximately $85 million from the Bithumb exchange. A massive purchase by large investors in XRP, given that this is large institutional interest in XRP as they position for future gains.
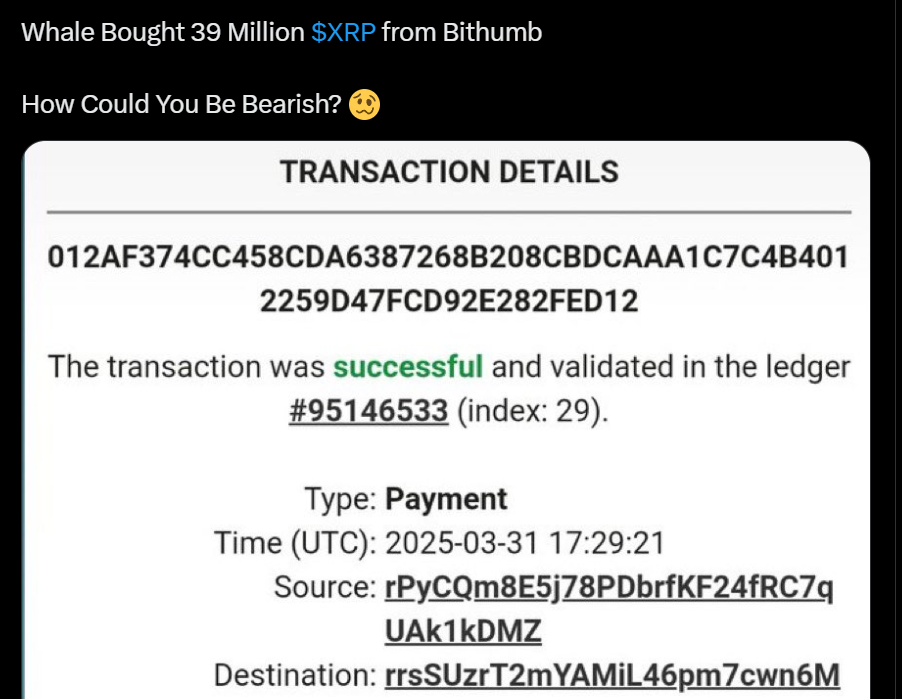
Moreover, when whales are active in the market, it is a sign of long-term confidence. Institutional investors making big trades is usually a positive signal that they anticipate further price appreciation.
XRP Price Faces Key Resistance at $2.20
The short term price action of XRP‘s is very much dependent on its market capitalization. It is the key support level in recent months at the $121.8 billion market cap level. This areashort-term has been tested a couple of times and can have a strong support for the price to rally higher depending on the strength.
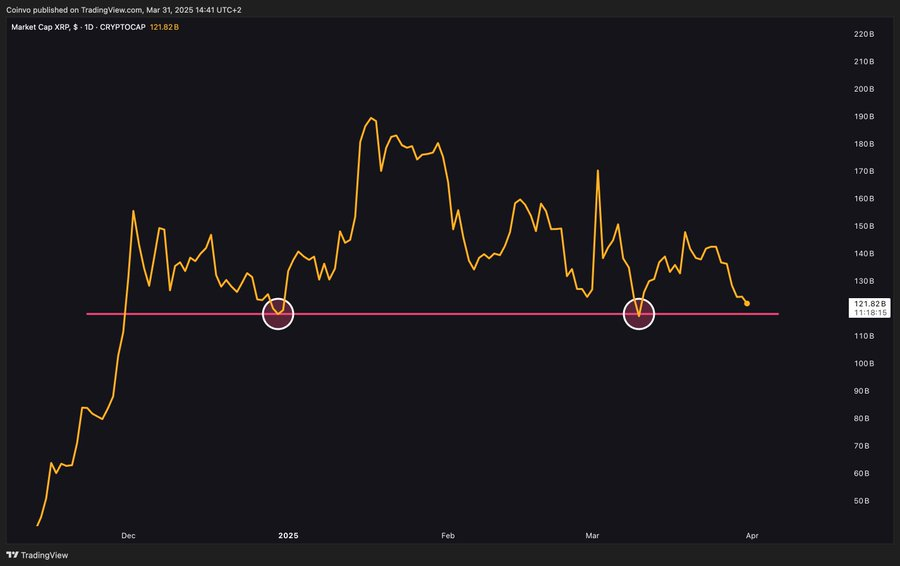
Above this support, if XRP’s market cap holds, it can serve as the trigger for a rebound and an upward momentum. On the other hand, if the market cap falls below this level, it may be viewed as a continuation of consolidation or even a deeper drop in price.
Price Action and Technical Indicators
In the last 24 hours, XRP has risen by 3.37% to $2.1604. But the price has still not been able to clear the all-important resistance, that of $2.20, which has obstructed the price in the run-up previously. If XRP can overcome this resistance, it may end up in the $2.50 range.
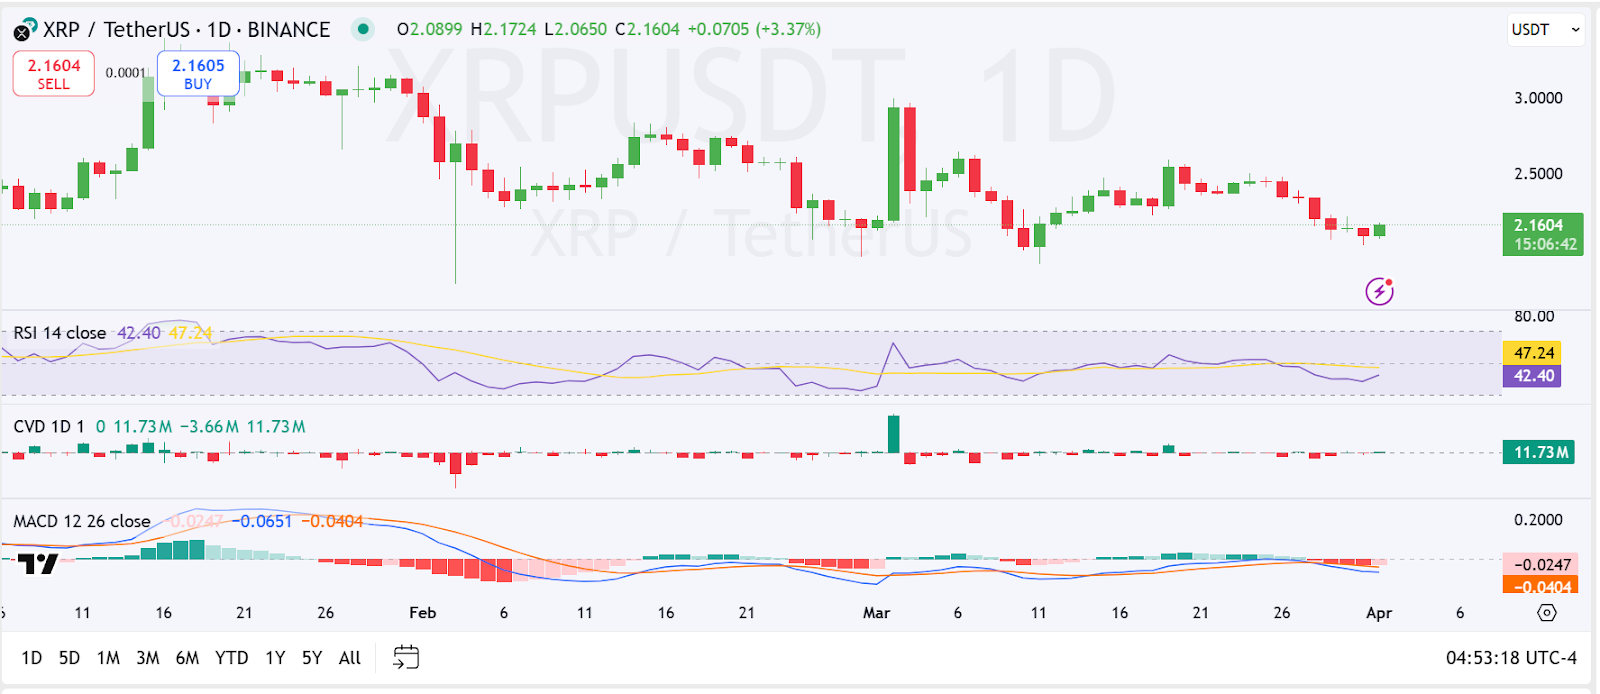
The RSI stands at 42.40 which indicates a neutral signal. If a rise above 50 shows stronger buying momentum; while if it fell below 40, it would mean weaker buyer interest. The MACD has slight bullish momentum, the MACD line is below the signal line signaling that overall momentum is still weak.
Meanwhile, Cumulative Volume Delta (CVD) is at 11.73 million which means that buyers exert more pressure than sellers. However, the -3.66 million negative volume earlier suggests some caution among traders, especially during price dips.
Disclaimer
This article is for informational purposes only and does not provide any financial, investment, or other advice. The author or any people mentioned in this article are not responsible for any financial loss that may occur from investing in or trading. Please do your research before making any financial decisions.


