
 Puffer
 ZKsync
 Bitcoin
 NEAR Protocol
 Pearl
Pearl Quantus
 Sui
Sui

Key Insights:
- TD Sequential flashes a weekly buy signal for Ethereum.
- Ethereum trades inside Fibonacci golden pocket, faces $1,724 resistance.
- Stochastic RSI hints at bearish correction toward $1,400.
Ethereum price entered a critical phase this week, as traders split on whether the asset will break above $1,700 or retest $1,400. Analysts tracking ETH’s price movement flagged both bullish and bearish technical indicators, leaving markets on edge.
At press time, ETH traded just above $1,620, facing continued resistance near the $1,650 level.
Ethereum Price Faces Bearish Pressure at Key Fibonacci Zone
A sharp sell-off on April 7 created a Fair Value Gap (FVG) on the 4-hour timeframe, signaling heavy selling pressure. According to a TradingView analysis by Youriverse, Ethereum failed to reclaim this level during multiple intraday rallies. The chart shows the FVG sits between $1,600 and $1,670, with sellers repeatedly rejecting upward attempts.
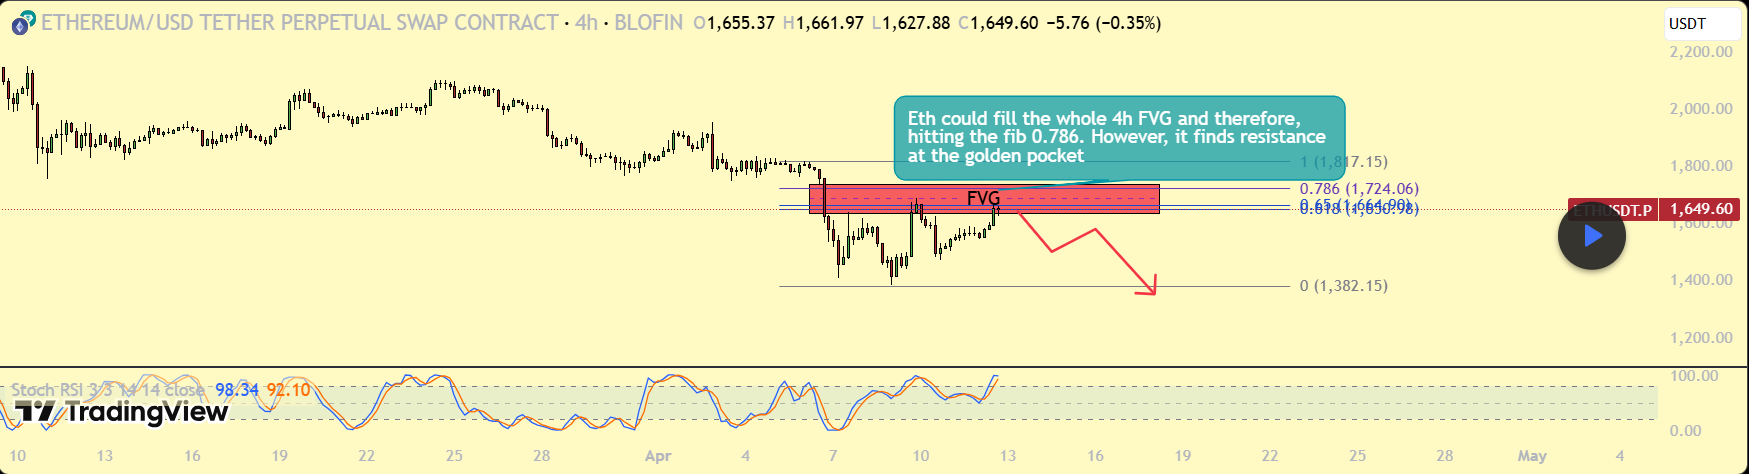
Ethereum also trades within the golden pocket of the Fibonacci retracement zone, drawn from the April 9 low at $1,383. Any sustained rejection here could drive the price down to $1,400 or below. The analysis warns of further losses if ETH fails to break the 0.786 Fib level at $1,724.
Stochastic RSI readings added more weight to the bearish view. The indicator approached overbought territory on the daily timeframe, hinting that Ethereum could soon run out of momentum. If selling pressure resumes near the FVG, analysts warn that price could collapse toward the $1,400 zone again.
TD Sequential Hints at a Weekly Buy Signal for Ethereum Price
Not everyone sees a breakdown ahead. Ali, a crypto analyst at X, pointed to a bullish signal flashing on the weekly chart.
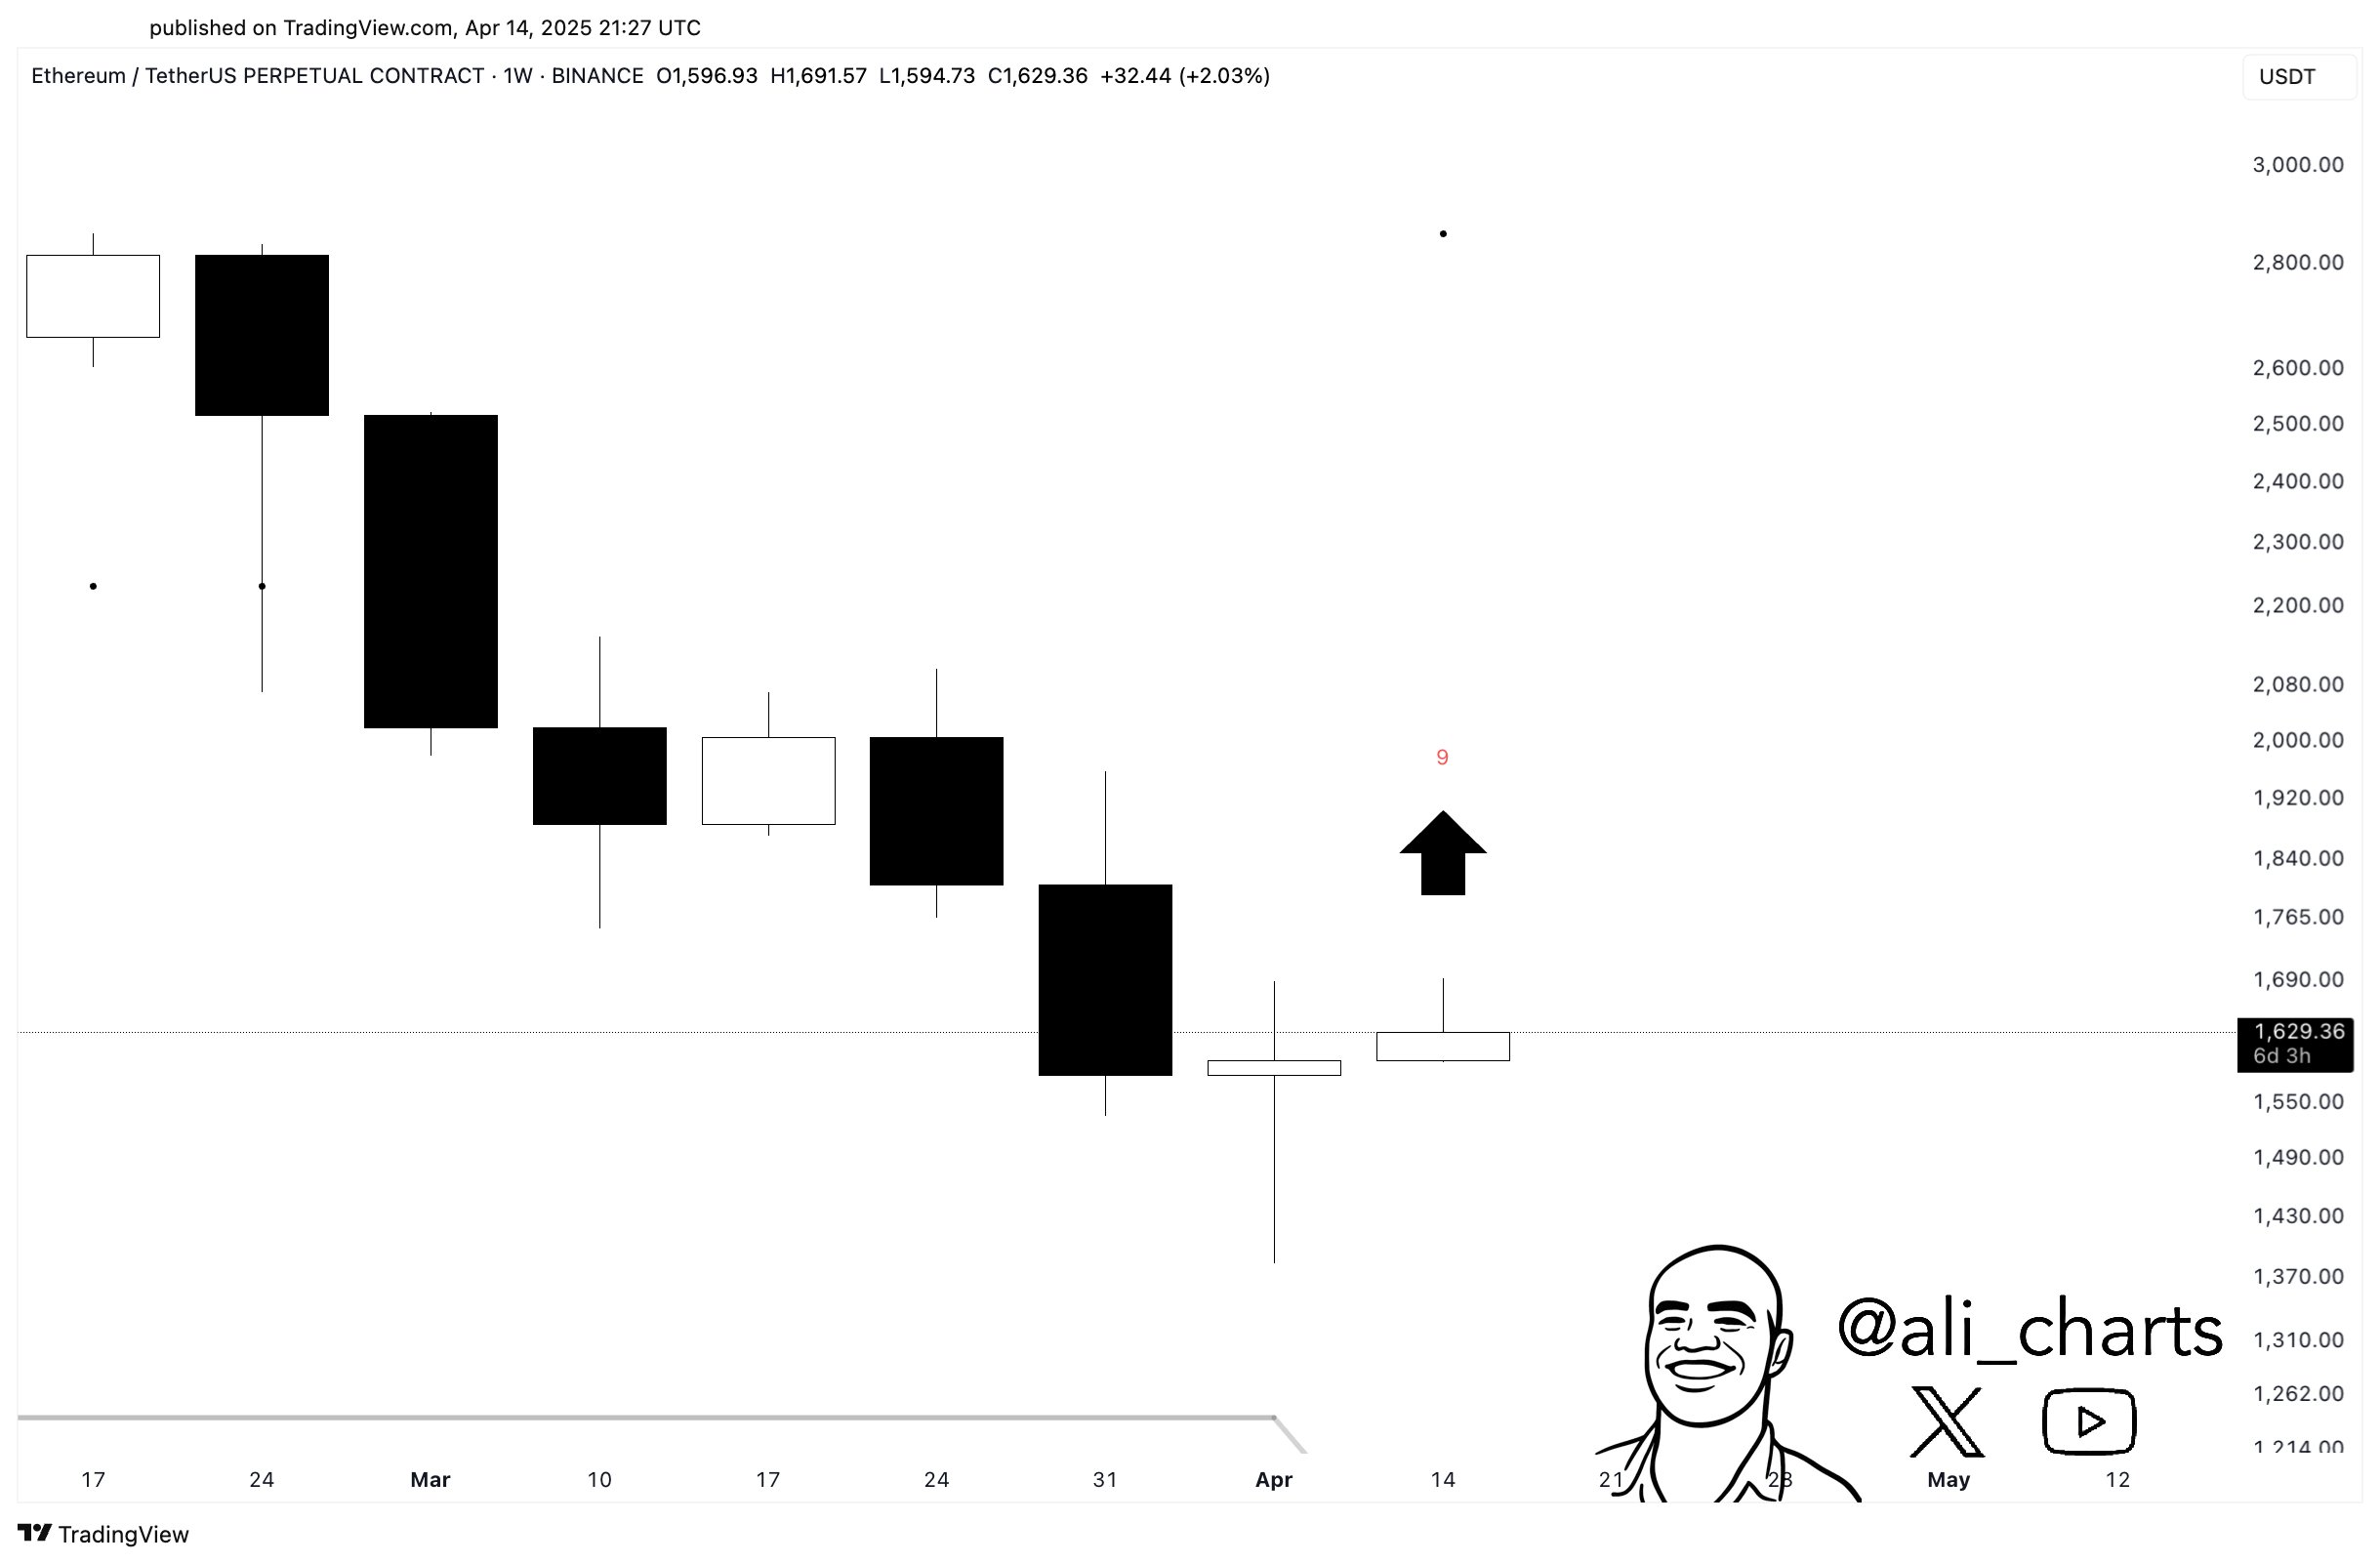
“#Ethereum $ETH may be gearing up for a major rebound, with the TD Sequential flashing a buy signal,” Ali wrote. The TD Sequential indicator is commonly used to identify potential price reversals during established trends.
ETH remains stuck in a tight consolidation zone, but the weekly setup suggests that a strong bounce may be forming. The presence of the buy signal on a higher timeframe lends credibility to the recovery thesis.
However, price must clear the $1,700 resistance and flip it into support for the bullish scenario to unfold.
Market Sentiment Remains Mixed Amid Dominance Lows
Ethereum’s dominance in the crypto market neared all-time lows last seen in 2021. As noted by Rekt Capital, the ETH Dominance chart has dropped into a critical support area.
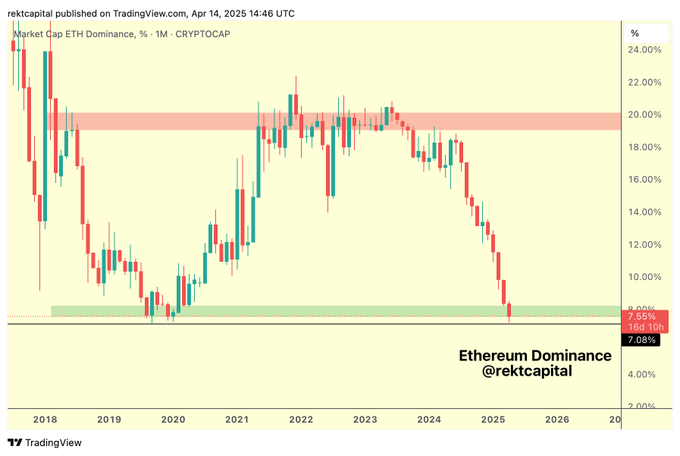
A rebound in ETH’s dominance could mark a turning point for the broader altcoin market. For now, however, weakness in dominance reflects the asset’s inability to outperform Bitcoin.
Bulls Eye $8,000—but Must Survive the Shakeout First
Merlijn The Trader described Ethereum’s current setup as a textbook breakout pattern.
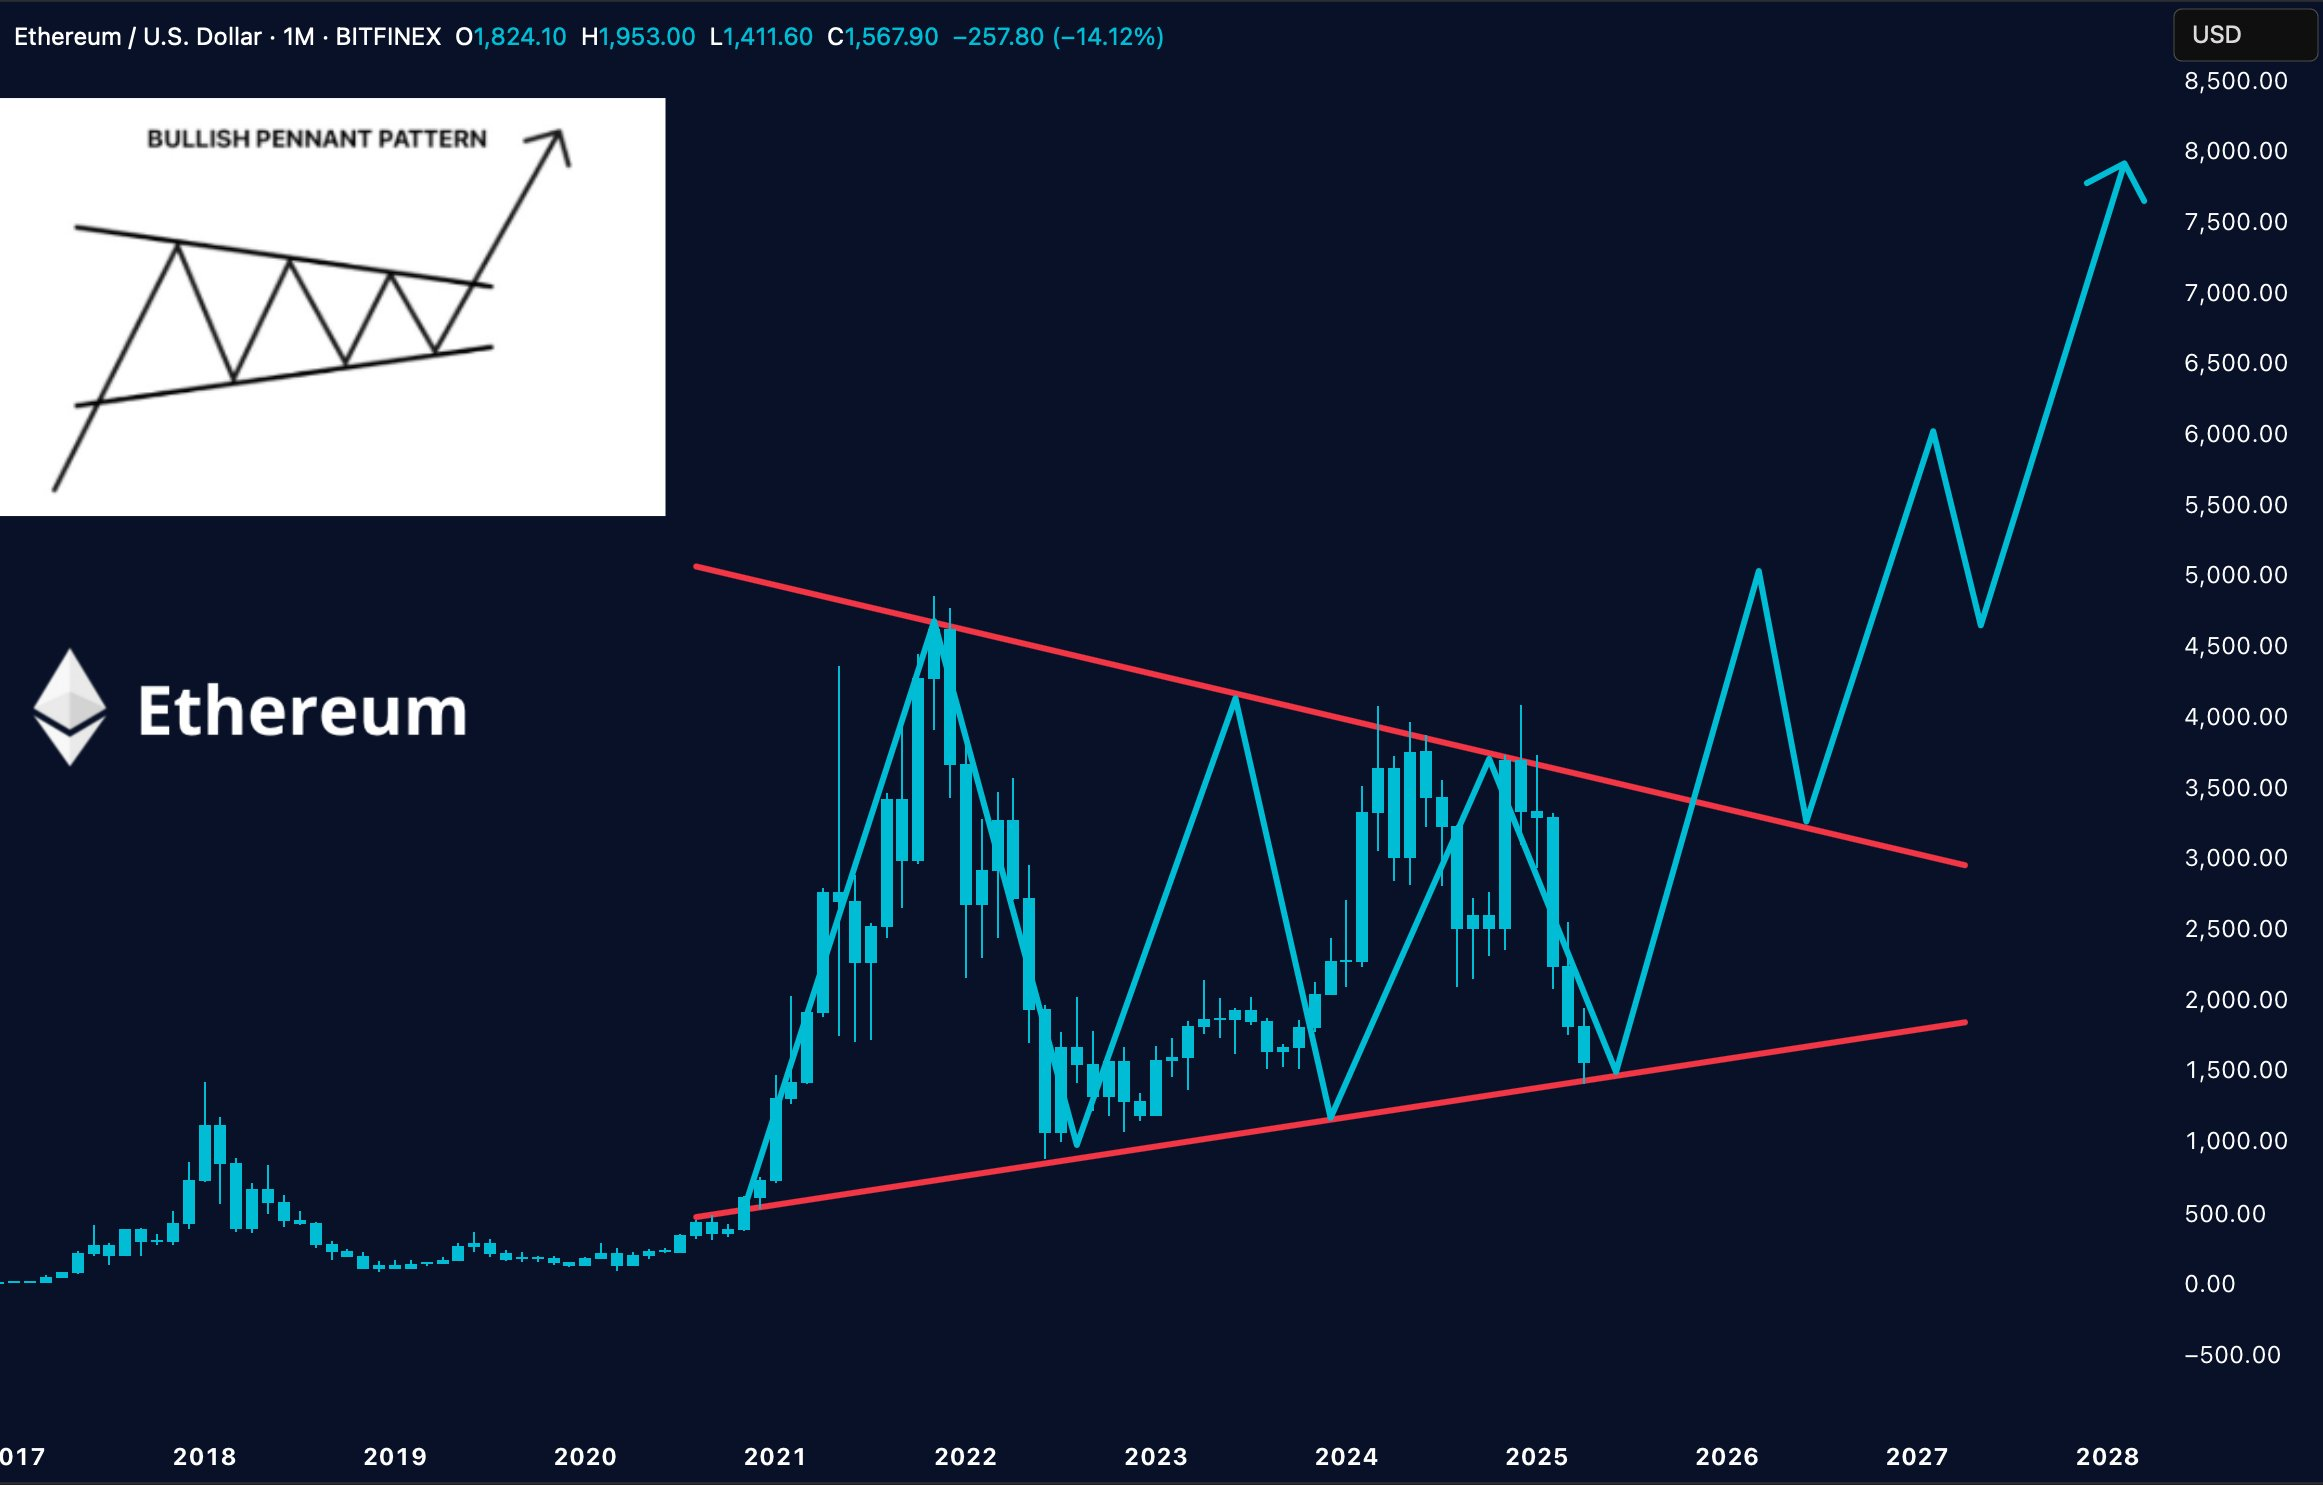
“They say Ethereum is dead. But the chart says: Loading breakout…” he posted on X, referring to a bullish pennant formation and multi-year consolidation range.
While bold, the target echoes a broader expectation among long-term holders. They anticipate an explosive move once Ethereum exits its prolonged sideways structure.
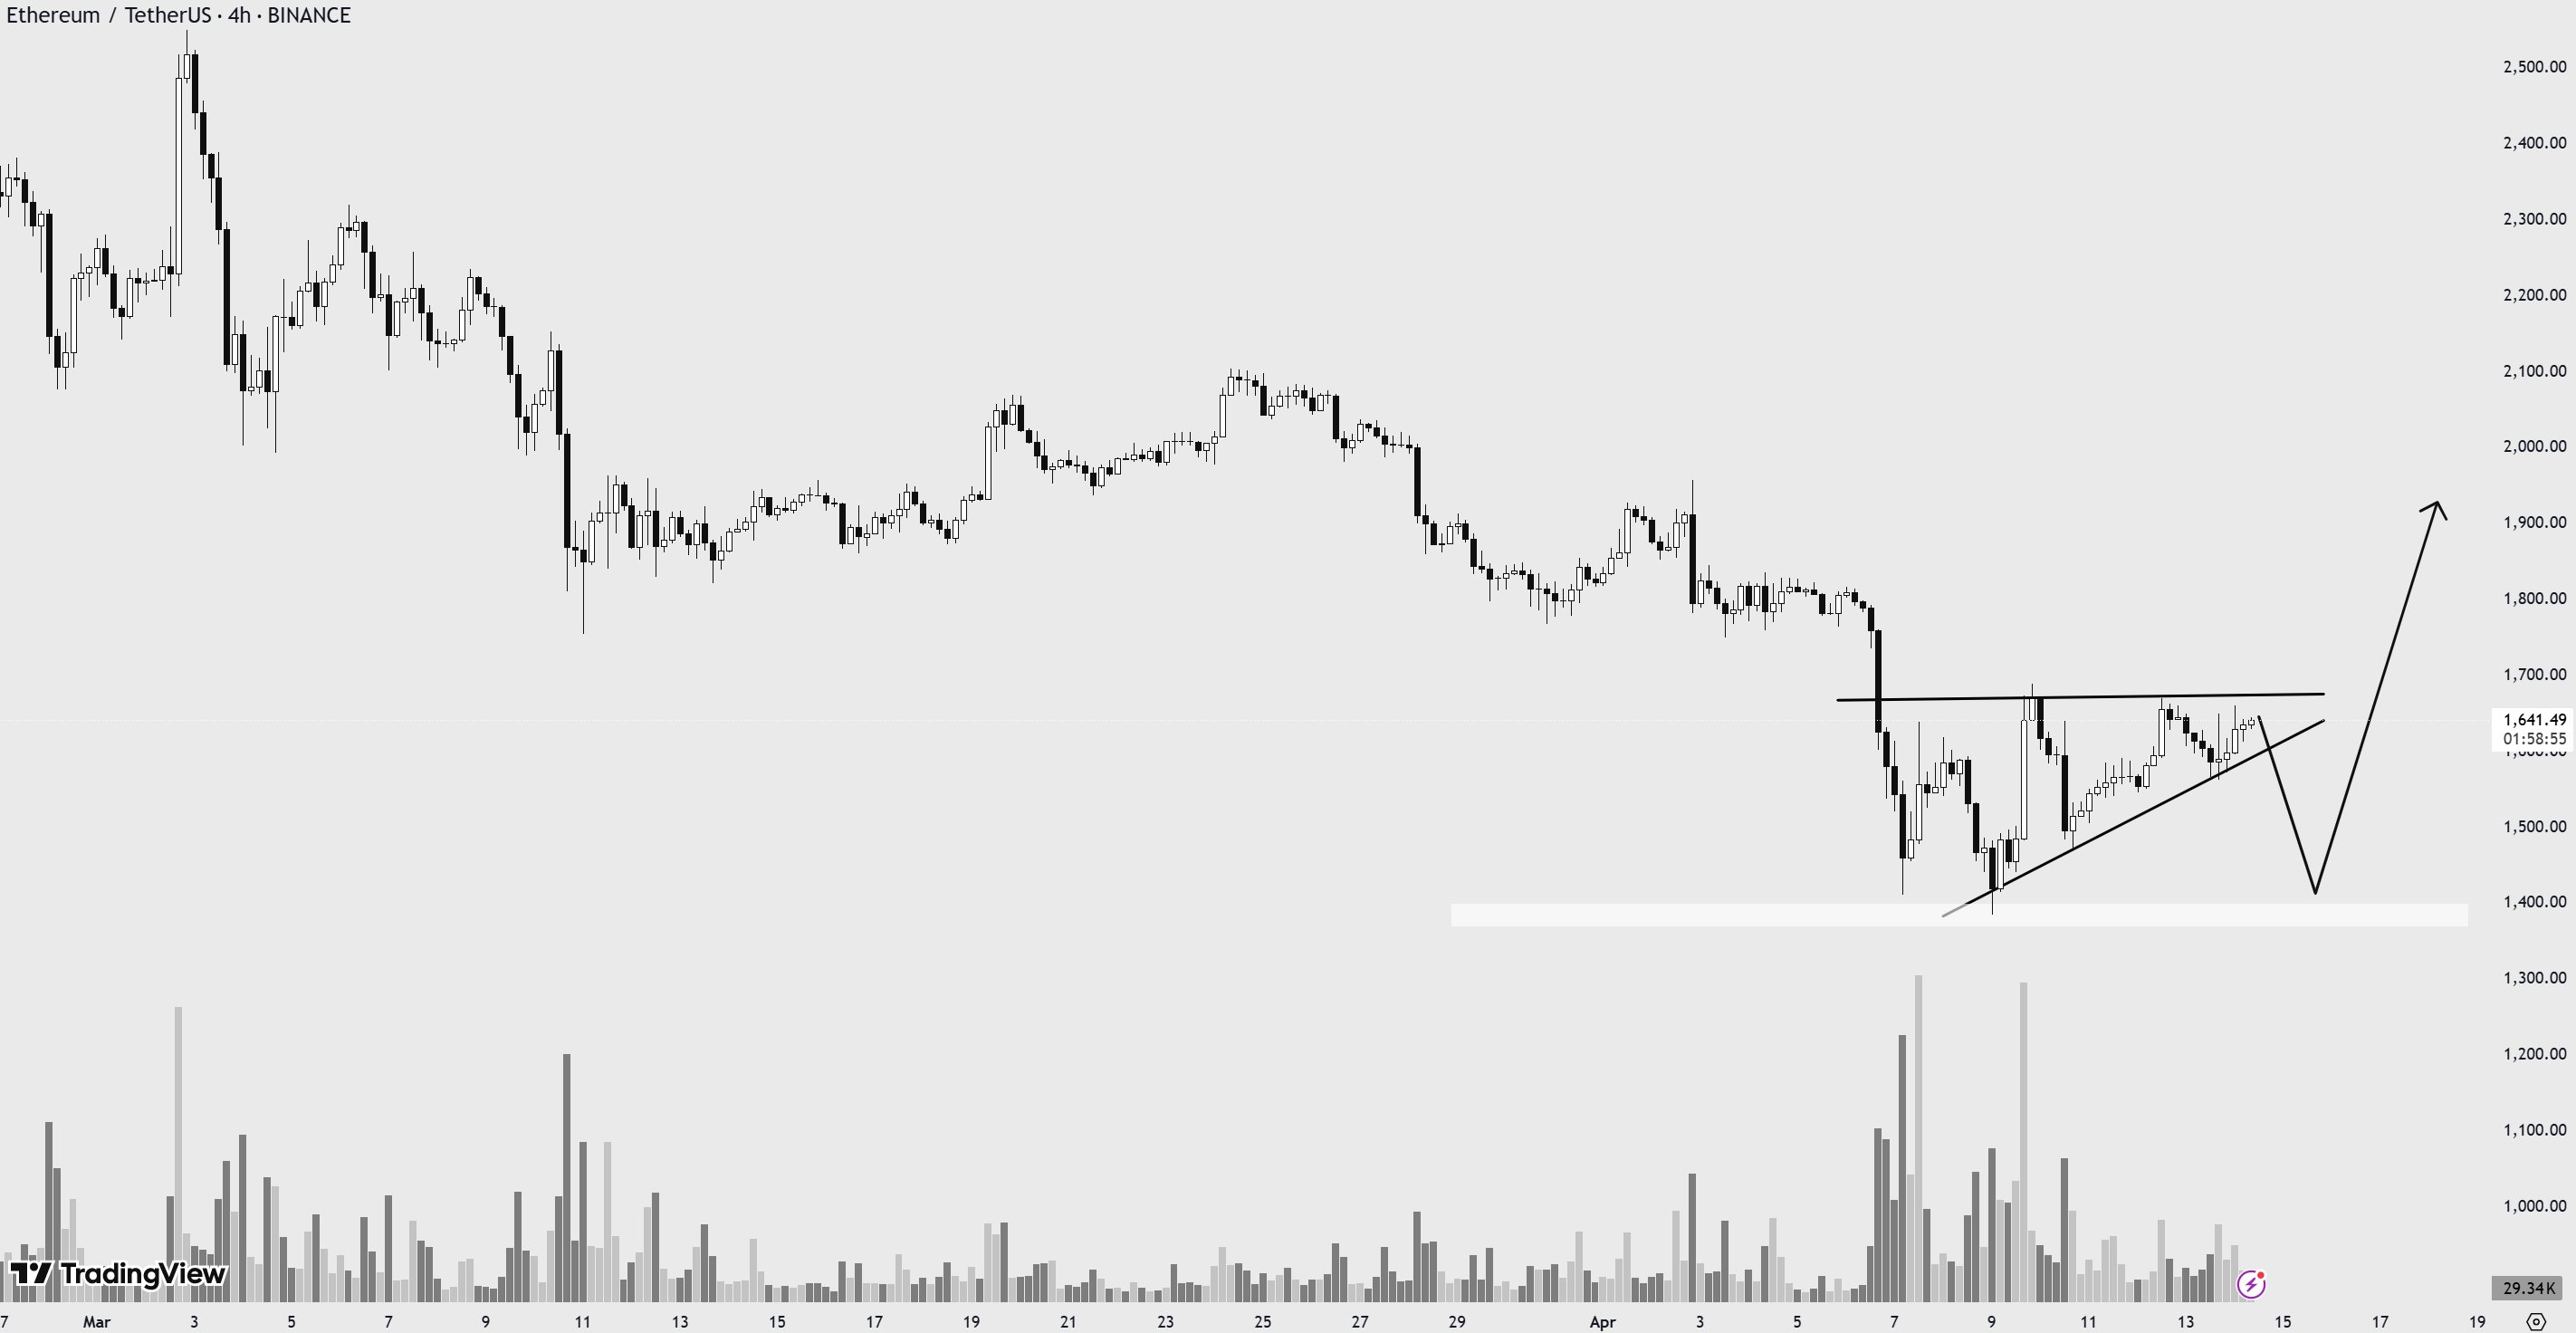
Yet, others like BOBO underscore that ETH remains inside a descending triangle, hinting at short-term risk. “We could see another dip before a potential recovery,” he warned, though he leaned toward a direct breakout past $1,700.
Ethereum price stands at a pivotal moment. The weekly buy signal and bullish patterns offer hope for a rebound. But ongoing resistance, a key Fair Value Gap, and weakening dominance complicate the outlook.
If ETH reclaims $1,724, the bullish thesis could gain momentum. Failure at current levels, however, risks a drop toward $1,400—or lower.
Disclaimer
This article is for informational purposes only and does not provide any financial, investment, or other advice. The author or any people mentioned in this article are not responsible for any financial loss that may occur from investing in or trading. Please do your research before making any financial decisions.


