Dacity Coin
 astronaut
 streamoors
 Celestia
 NeoSoul
 Sui
Sui Injective

Key Insights:
- Ethereum faces heavy supply pressure near $2.8K from over 2.5M ETH held at breakeven.
- Price now trades above Realized and Market Mean levels but below Active Realized Price at $2.9K.
- ETH spot ETFs saw $58.63M inflows in six days, with total net assets rising to $9.12B.
Ethereum (ETH) approached the $2,800 resistance zone, where millions of tokens were previously acquired. This level presents a risk of supply-driven selling. However, strong ETF inflows and improved on-chain positioning suggest bullish market momentum as ETH nears a potential breakout.
$2.8K Breakeven Zone Presented Critical Resistance
Glassnode data showed that more than 2.5 million ETH remained held in wallets with a cost basis around $2,800. As the price revisited this level, some investors began recovering losses. Historically, breakeven zones prompted distribution from holders seeking to exit at break-even, potentially creating near-term resistance.
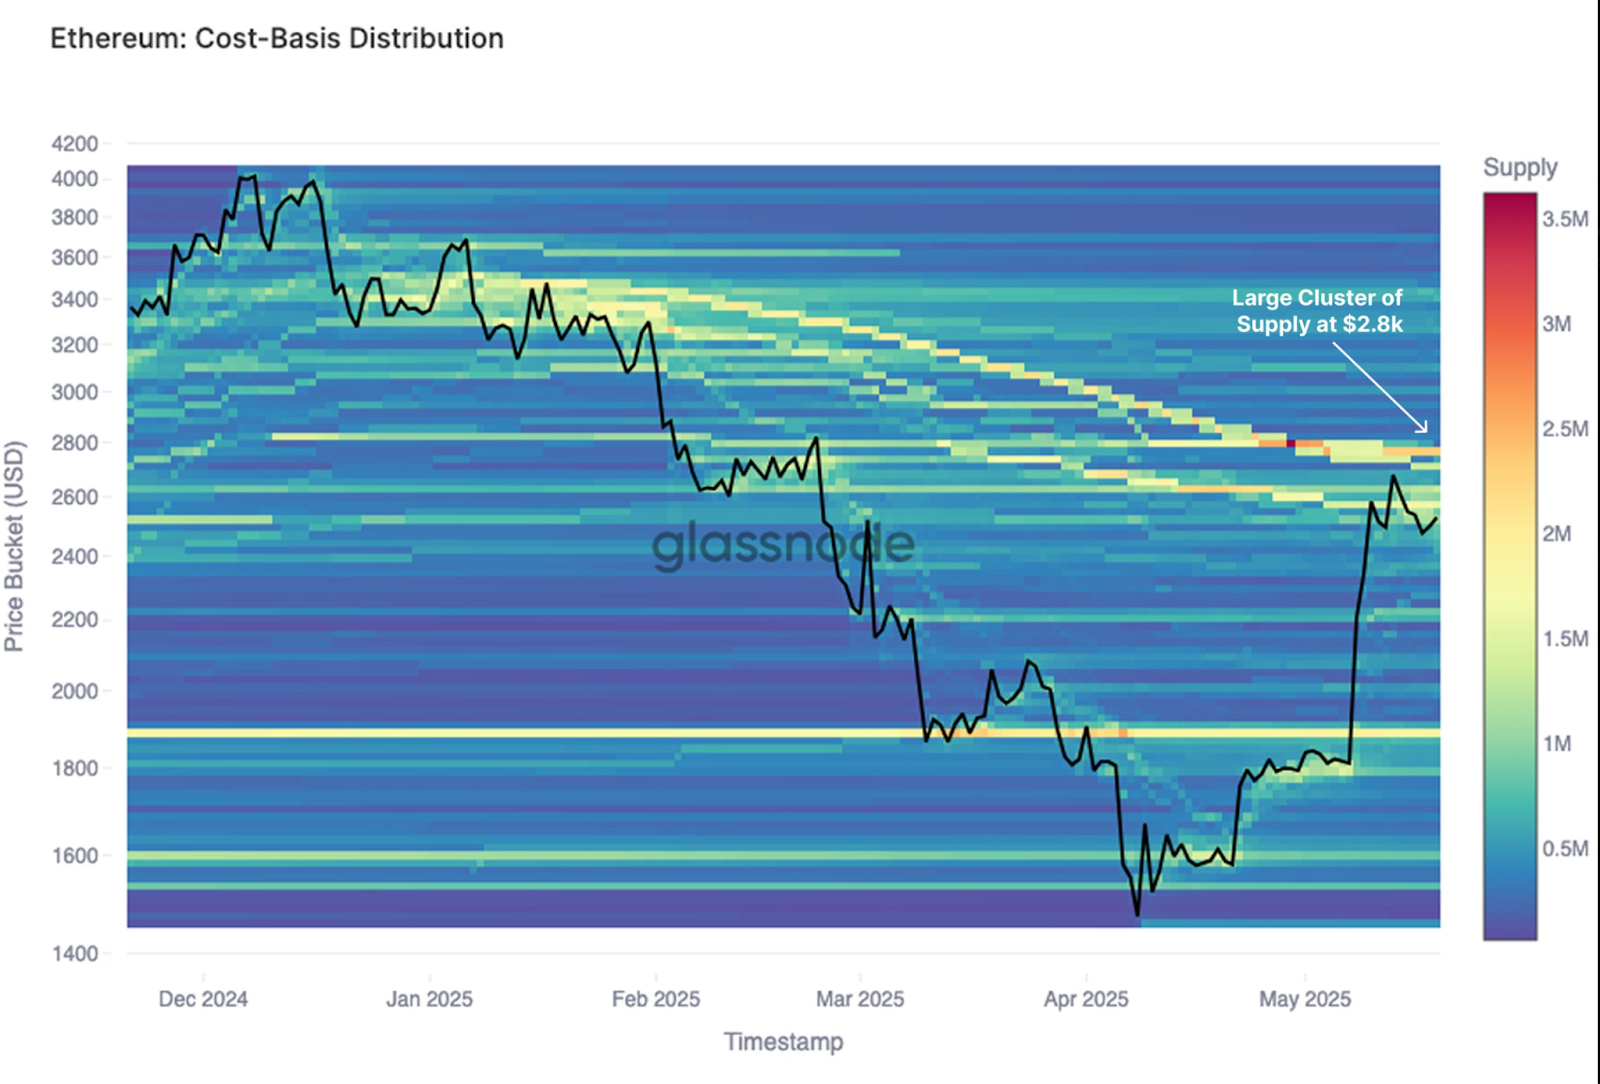
The rise in ETH’s price from $1,900 in April to over $2,560 now makes this supply concentration matter more.
The cryptocurrency has now surpassed its Realised Price at $1,900 and also gone beyond the True Market Mean at $2,400, which are considered encouraging signs for the structure of the market.
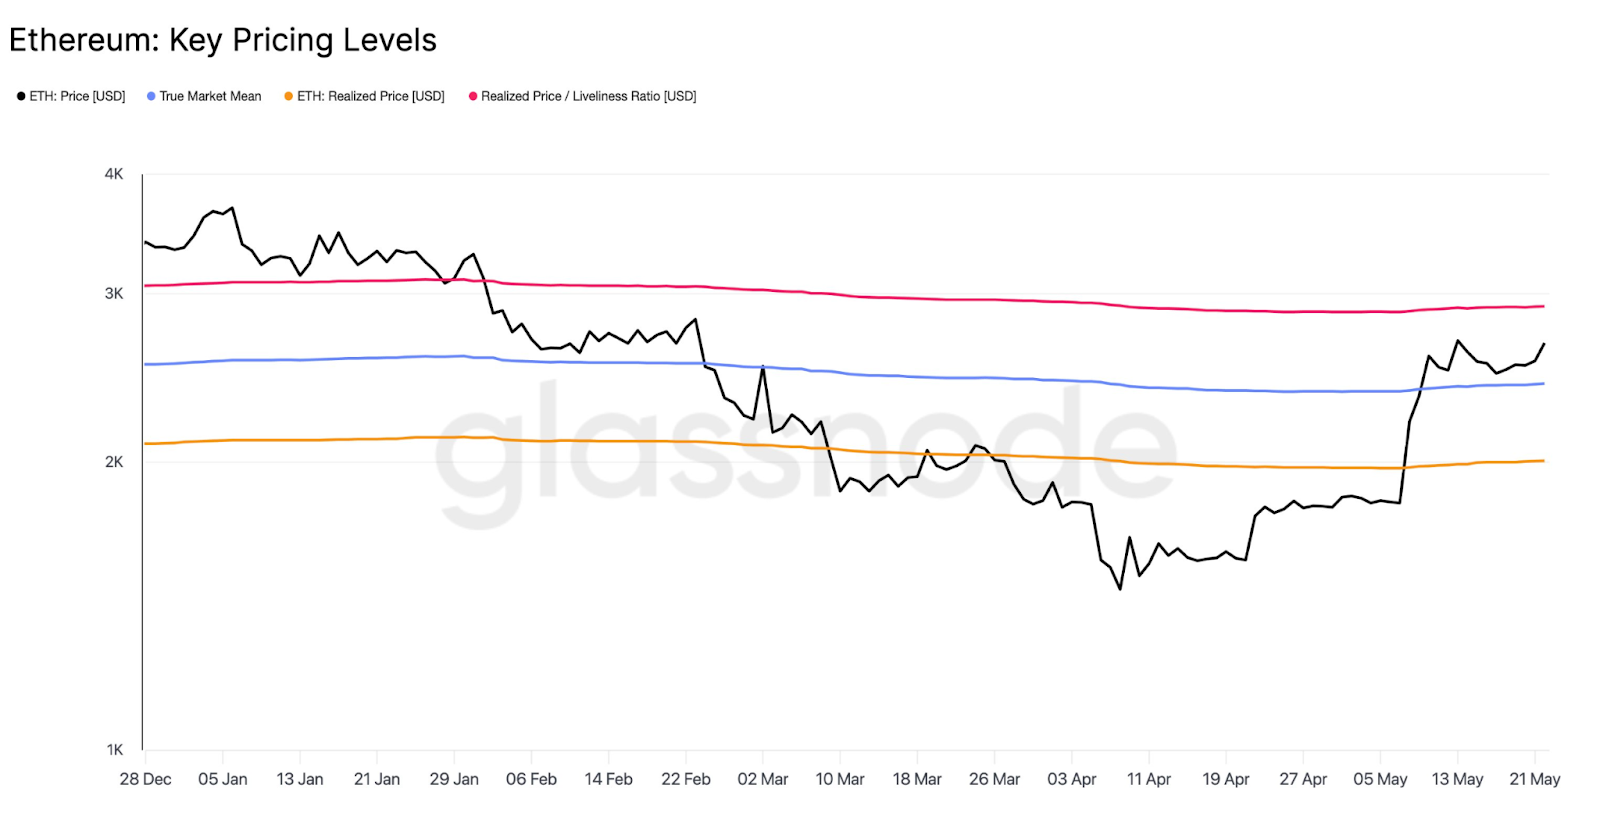
Even so, ETH is currently trading under the Active Realized Price of $2,900, which is the point where active users recently made their transactions.
As long as that price level is not reclaimed, some traders may continue to be cautious and view rallies as only temporary chances, not as a sign of a new trend.
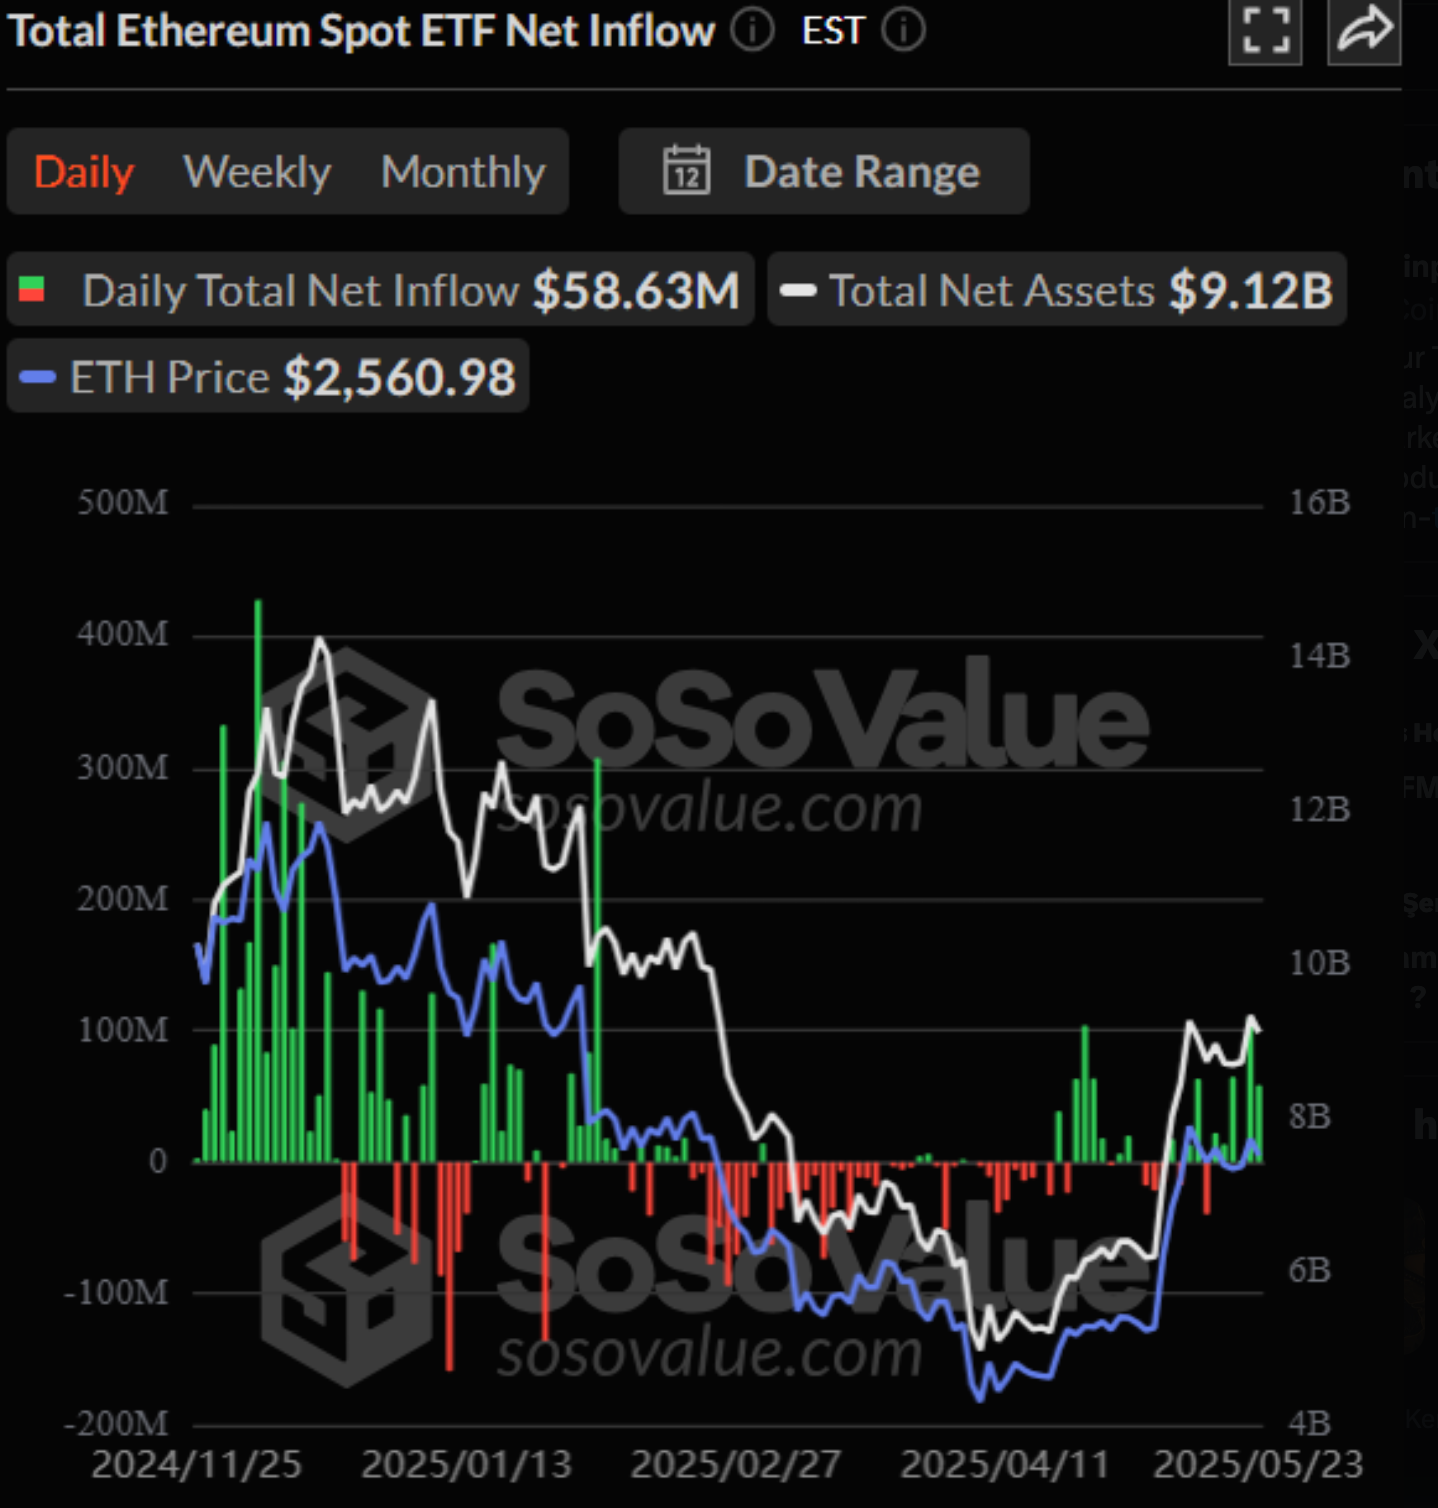
At the same time, ETH spot ETFs have contributed to a bullish mood by bringing in $58.63 million of new money for six straight days. SoSoValue’s data indicates that total ETH ETF assets now amount to $9.12 billion, indicating investors are showing more interest.
Market Structure Shifts as Ethereum Exits Accumulation Phase
Meanwhile, ETH’s market structure data indicates that the price is moving from accumulation and manipulation to distribution.
The chart by MerlijnTrader makes it clear that the recent price rise above $2,500 might have started the distribution phase.

Between May 2024 and March 2025, ETH stayed in a narrow accumulation zone, and long-term buyers slowly started to come in.
After that, the market saw a brief but intense dip below $1,900, which likely caused some weaker holders to sell.
After the token broke through those zones and restored the Realized Price, traders are waiting to see if a wider uptrend is forming. Overhead resistance at $2,800 and $2,900 could cause the price to pause before going higher.
Top Trader Exits Ethereum Longs and Doubles Down on Bitcoin
As ETH got close to $2,800, some well-known traders decided to cut their losses. Lookonchain reported that JamesWynnReal, a famous trader, sold his ETH and SUI positions, causing him to lose about $5.3 million.

After that, he changed his approach and invested $1.19 billion in a long position on Bitcoin which amounts to 11,070 BTC.
Currently, that position has unrealized losses of over $20 million and a liquidation price of $104,820. Because of ETH’s overhead resistance, it appears that large traders are choosing to move their funds from ETH to BTC.
While a single trade does not shift the market, the way big capital is shifted often indicates changes in the opinions of professional traders. If ETH fails to move past $2,800–$2,900, many traders could move their funds into BTC or other assets that are performing well.
Still, the token`s recovery to the Realized and Market Mean levels suggests the overall structure is still in place.
Disclaimer
In this article, the views and opinions stated by the author or any people named are for informational purposes only. And they don’t establish the investment, financial, or any other advice. Trading or investing in cryptocurrency assets comes with a risk of financial loss.