
 Bitcoin
 Ondo
Ondo NEAR Protocol
 Walrus
 Pearl
Pearl Pons
Pons Ethereum

Key Insights:
- Ethereum whales added 1.49M ETH as retail exited.
- Spot ETH ETFs saw $1.37B inflows before streak ended.
- ETH/BTC chart signals potential altseason rotation ahead.
Ethereum whales bought 1.49M ETH, spot ETFs saw $1.37B inflows, and technicals point to a breakout as ETH/BTC prints a 2020-style reversal.
Whales accumulate as retail exits, ETFs cool
Ethereum whales and sharks have stepped up accumulation, even as retail participants reduce exposure.
Wallets holding between 1,000 ETH and 100,000 ETH added 1.49 million ETH over the past 30 days, according to Santiment. The net inflow—worth roughly $3.79 billion—represents a 3.72% increase in their collective holdings. These addresses now control 41.61 million ETH, or nearly 27% of the current circulating supply, the firm said in a June 13 post.
“Over the past month alone, these key whale and shark wallets have rapidly added more coins as retail traders have taken profit,” Santiment wrote.
The timing of this rotation coincided with muted price performance. Ether is up just 1.8% over the last two weeks and 3.8% over the past 30 days, data from CoinGecko shows. ETH traded at $2,575 at press time, nearly 48% below its all-time high.
ETF inflows hit $1.37B before streak ends
While whales bought spot ETH, the institutional market also showed growing interest.
United States-based spot Ethereum exchange-traded funds (ETFs) saw a combined $1.37 billion in inflows over a 19-day streak that ended on Friday, according to Farside data. The streak marked the longest net inflow period since ETF products launched in July 2024.
BlackRock’s iShares Ethereum Trust led inflows during the period, cementing institutional interest. However, the streak snapped with a $2.1 million net outflow, suggesting a pause in ETF momentum.
Crypto Beast noted the June inflows surpassed $800 million, accounting for more than 20% of all spot ETH ETF volume since inception.
Sharplink fallout reflects market anxiety
The first Ethereum treasury stock failed to capitalize on broader market momentum.
Shares of SharpLink Gaming dropped 73% in after-hours trading on June 13 after the firm filed to register a large volume of common shares for potential resale. The market interpreted the move as dilution, despite the company’s stated plan to use proceeds to purchase Ether.
Joseph Lubin, chairman of Sharplink and CEO of Consensys, dismissed the selloff as a misunderstanding of the filing. Sharplink had announced plans to raise up to $1 billion in a May 30 prospectus, earmarking most of the funds for ETH accumulation.
The collapse highlighted the challenges of integrating crypto strategies into traditional equity markets without triggering shareholder concern.
On-chain metrics hint at rising network strength
Glassnode data supports the view that Ethereum is quietly strengthening on-chain.
The number of active Ethereum addresses has remained stable, with no major spikes or collapses. This signals steady user activity, even as ETH price fluctuates. In past cycles, sharp growth in address activity often preceded upward price momentum.
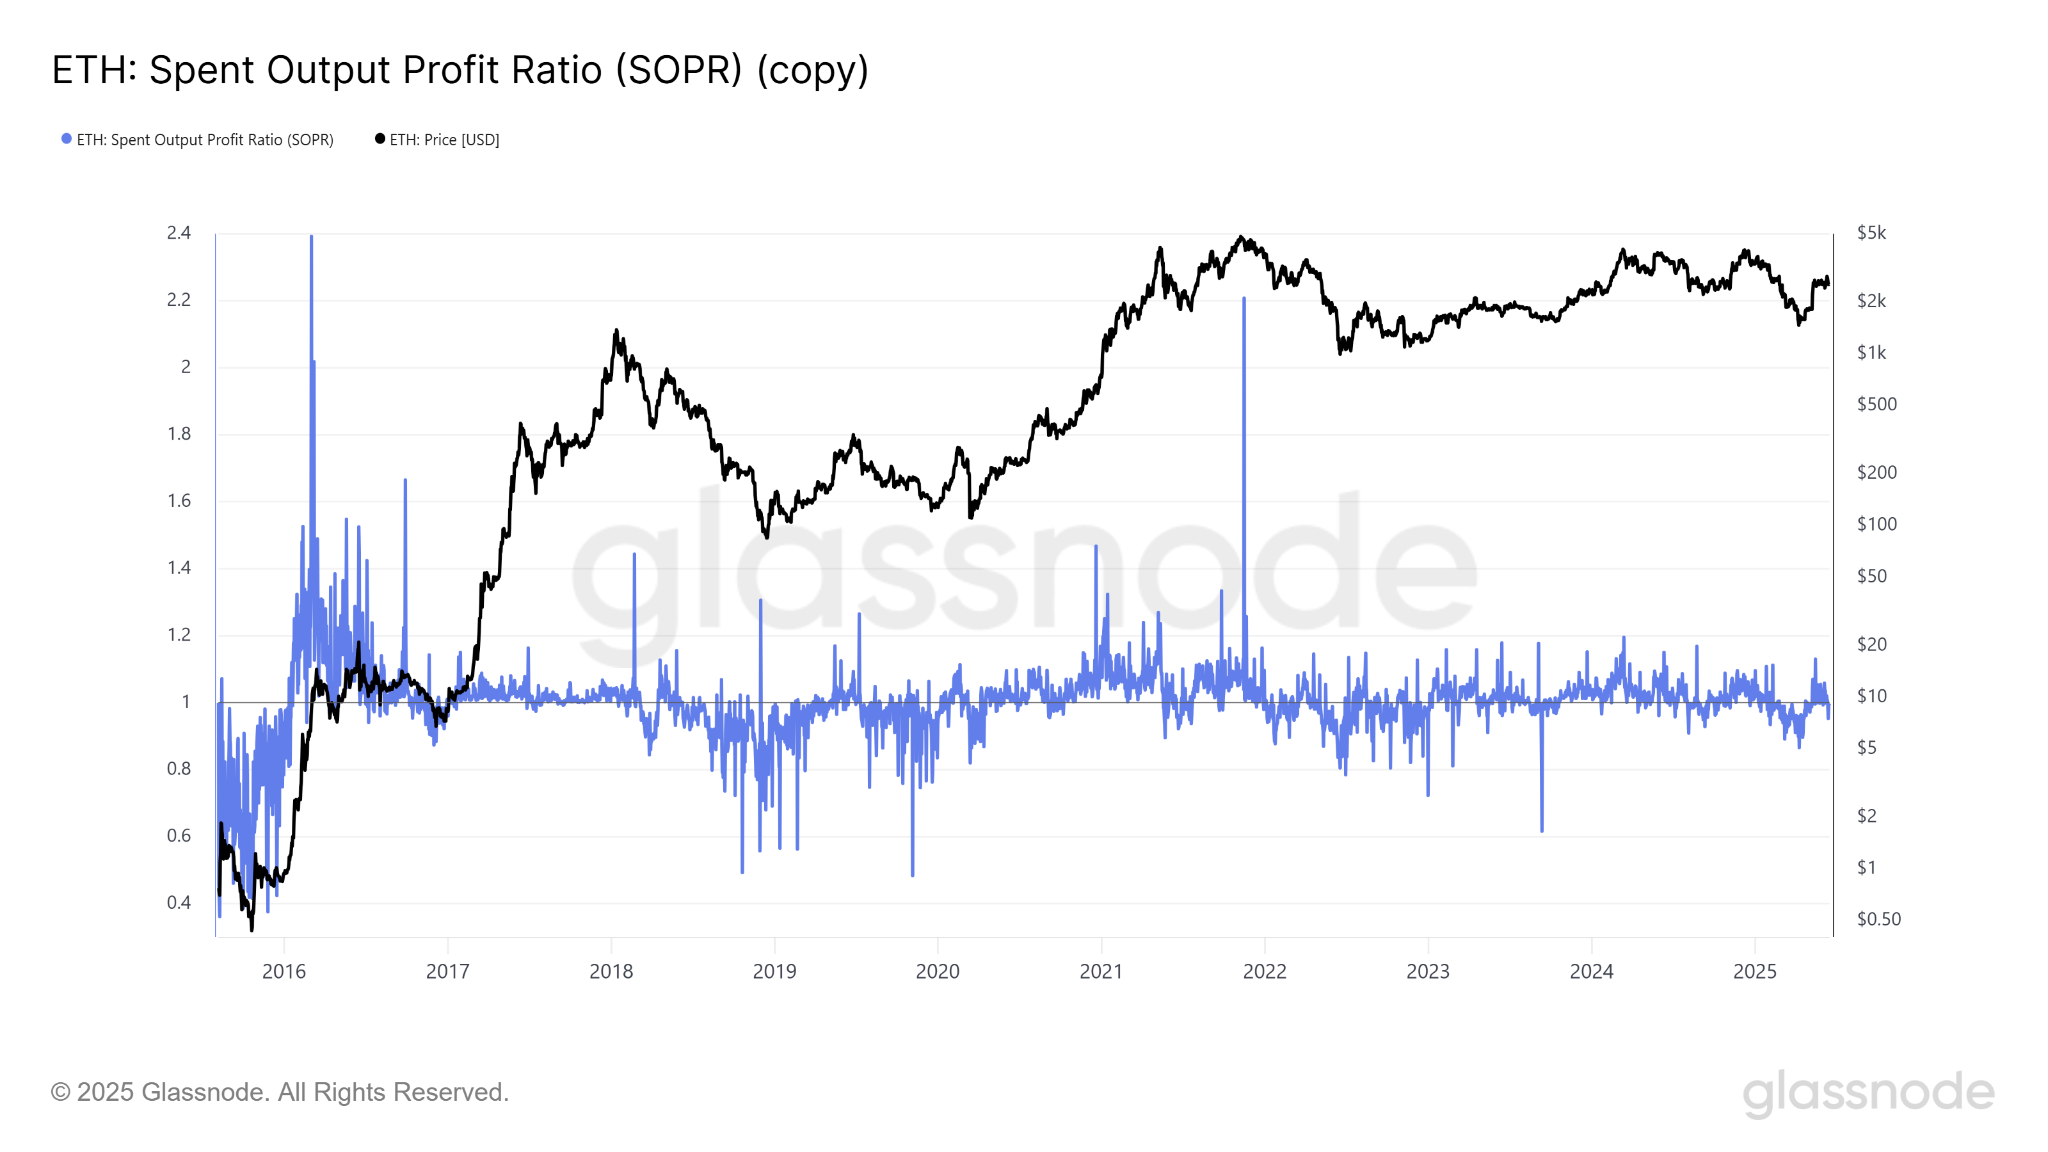
The Spent Output Profit Ratio (SOPR) metric also points to a shift. The SOPR hovered near the neutral line, suggesting recent ETH transactions are happening near cost basis levels. This implies minimal realized profit-taking, further confirming accumulation behavior over speculative exit.
At the technical level, Ethereum trades just under the 50-week moving average ($2,683) and 200-week moving average ($2,623), per TradingView data. The price currently hovers at $2,605. A successful break above this confluence zone could flip ETH back into bullish territory.
Stochastic RSI sits in the overbought zone, indicating potential short-term exhaustion, but this has historically aligned with breakout rallies.
ETH/BTC reversal echoes 2020 rotation
Trader Merlijn noted that the ETH/BTC chart recently flashed the same reversal pattern seen in 2020, when Ethereum dramatically outperformed Bitcoin. “Now? The same pattern is unfolding with even more capital,” he posted on June 14.
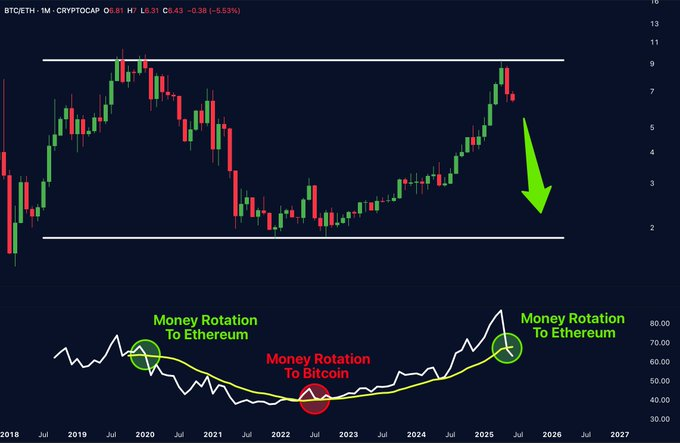
He argued the “flip” toward ETH has already started. “Ignore it at your own risk,” he said.
While Bitcoin still commands most institutional inflows, the growing ETF demand, whale accumulation, and ETH/BTC structure suggest Ethereum is regaining attention as a leading macro play in the crypto market.



