NEAR Protocol
 Pearl
Pearl Bitcoin
 Puffer
 ZKsync
 Pudgy Penguins
 Hyperliquid
Key Insights:
- Shiba Inu price has formed a double-bottom pattern on the daily chart.
- On-chain data shows that the balance of SHIB coins on exchanges has fallen.
- The whale selling that happened earlier this year has stalled.
Shiba Inu price has been in a downtrend this year as most utility and meme coins plunged. It trades at $0.000118, down by 67% from its highest point in November last year. Still, the SHIB coin could be on the verge of a bullish reversal as exchange reserves fall, whale selling eases, and double-bottom pattern forms.
Shiba Inu Price to Benefit as Exchange Reserves Fall
Santiment data reveals that investors continue moving their SHIB coins from centralized exchanges (CEX) to their self-custody wallets. Whenever this happens, it is a sign that these participants are aiming to hold their tokens for a long time.
Shiba Inu’s centralized exchange reserves have dropped to 140.4 trillion today, July 1, the lowest level since May 9 of this year. This is a big drop since these reserves stood at over 141.5 trillion at their highest level in June.
The drop is also notable because it happens at a time when SHIB was in a downward trend. In most cases, investors move their tokens to exchanges when they are on a downward trend.
Whale Dumping Has Ended
The othe bullish catalyst for the Shiba Inu price is that large investors, popularly known as whales, are no longer selling the coin as they did a few months ago.
Data shows that the supply of SHIB held by whales, excluding exchanges, has remained at 709.7 trillion tokens since June 7. This is a major contrast to what happened a few months ago when this supply plunged from the year-to-date high of 743 trillion.
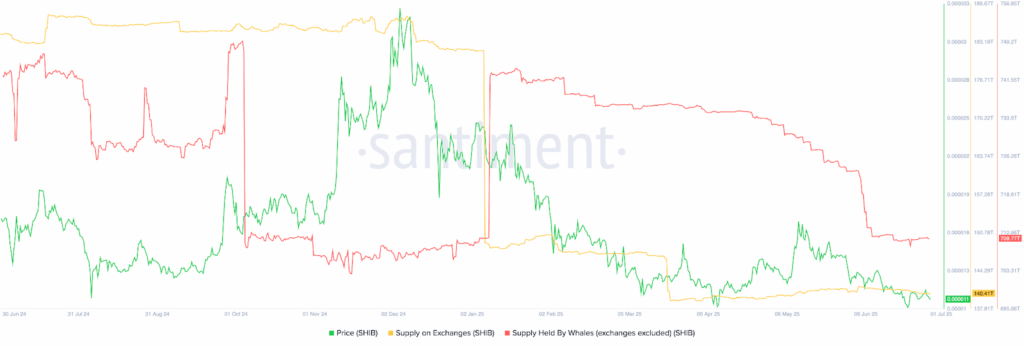
Whale selling ended after the recent Shiba Inu price surge that happened in April. At the time, the token soared by over 71% as most altcoins, including Ethereum, climbed.
SHIB Price Technicals Signal a Rebound is Coming
A technical analysis on the daily timeframe suggests that a comeback is coming. The chart below shows that the token plunged to a low of $0.00001035 in June as the war between Iran and Israel intensified.
That lowest point was notable because it coincided with the lowest level in April this year. As a result, it has formed a double-bottom pattern, a popular bullish reversal sign.
This pattern has two key parts: two downward-facing swings and a neckline, which, in this case, is at $0.00001755, the highest level in May this year. The pattern also happens when an asset is in a downtrend, which is the case with Shiba Inu.
Further, the Percentage Price Oscillator (PPO), which is a unique modification of the MACD, has pointed upwards. The same is true with the Relative Strength Index (RSI), which has moved above the descending trendline that connects the highest swings since May 10.
Therefore, the combination of a double-bottom patten and a bullish divergence points to a strong rebound in the near term. If this happens, the initial target price to watch will be the neckline at $0.00001755, which is about 71% above the current level.
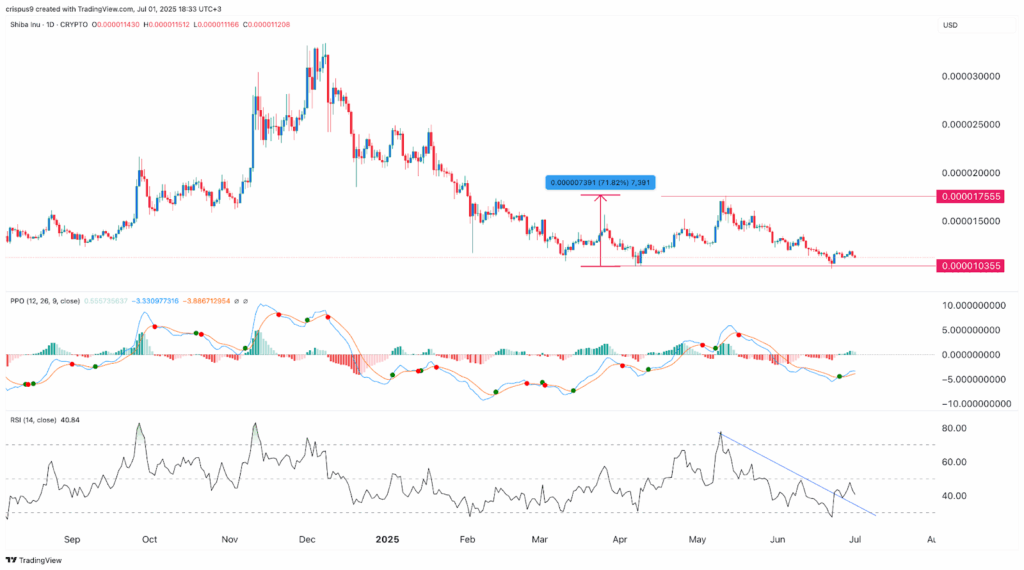
The bullish Shiba Inu price forecast will become invalid if the token drops below the double-bottom point at $0.00001035. Such a move will confirm that there are still more sellers willing to short below that level.
Shiba Inu price has crashed in the past few months. This downtrend could now be about to end afte the token formed a double-bottom pattern and a bullish divergence. There are also signs that whales are no longer selling the cin as they did a few months ago, which coud ease the selling pressure.
Still, SHIB faces some major risks, including the falling burn rate and the fact that the Shibarium network is not doing well, with its total value locked being in a downtrend.
Disclaimer
This article is for informational purposes only and provides no financial, investment, or other advice. The author or any people mentioned in this article are not responsible for any financial loss that may occur from investing in or trading. Please do your research before making any financial decisions.