
 Bitcoin
 Starknet
 Pearl
Pearl ZKsync
 NEAR Protocol
 Quantus
 Zerebro

Key Insights:
- PEPE coin price targets $0.000015 as triangle breakout nears apex.
- PEPE meme coin follows flag fractals that suggest a 20x surge may follow.
- Weekly Ichimoku reclaim aligns with the prior explosive breakout structure.
PEPE coin price is tightening near key resistance levels, with analysts now pointing to $0.000015 as the next short-term target. The breakout confirmation may trigger a long rally, putting the meme coin into a new parabolic cycle. Several chart arrangements indicated that the ongoing consolidation might be the last stage of an extensive price rise.
PEPE Coin Price Eyes a Breakout as Structure Tightens
PEPE coin price has formed a symmetrical triangle over the last two months. Such a setup is characterized by lower highs and rising lows, which signify compression. As Solberg Invest indicated, the current support zone is at $0.00001102 and $0.00001150. An upward breakout of this resistance wedge could push the coin up to $0.000015.
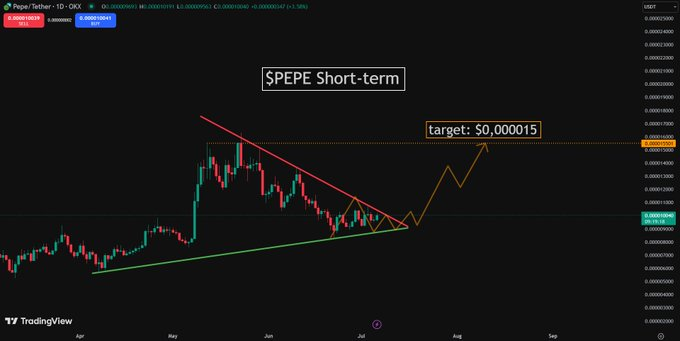
The chart posted by Solberg pointed out the bullish pattern and the distinct diagonal trendlines. Momentum shift would be confirmed by a decisive daily close above the upper bound of the triangle. If bulls defend this zone, the rally may move to the short-term highs. The trend corresponded to a typical breakout on meme coins in previous bull runs.
PEPE Meme Coin Follows Historical Fractal Patterns
On the macro scale, PEPE meme coin appeared to be repeating a multi-phase bullish pattern. Bitcoinsensus provided a weekly chart displaying patterns of fractal structures in the flag patterns that are topped by breakout expansions.
Since mid-2023, the coin has already gone through two accumulation cycles and 5 flags. Each breakout has followed after sustained compression.
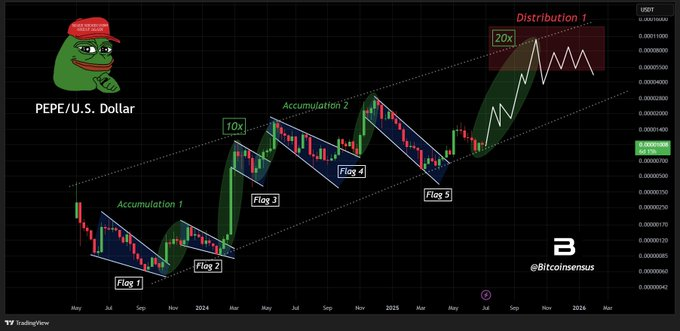
Based on this chart, the initial major accumulation resulted in a 10x jump. The second accumulation phase, which is currently coming to its conclusion, is expected to start a bigger move. The target rally is 20x with the current price, which implies a possible peak of around $0.000035 to $0.000045 area. These targets align with historical meme coin distribution patterns.
The chart also showed that PEPE meme coin remains within a long-term rising channel. The channel has served as dynamic support and resistance in the past year. The breakouts are always expected closer to the lower trending line, with the ensuing spikes directed to the upper side of the channel.
Ichimoku Cloud Reclaim Signals Early Breakout Strength
More so, the weekly analysis of Charting Guy showed more bullish indications through the use of Ichimoku Cloud. His chart marked two pink circles where PEPE coin price reclaimed the cloud baseline. The initial reclaim in late 2023 resulted in a major rally. There is a similar reclaim going on in the coin as it tries to break above the red cloud.
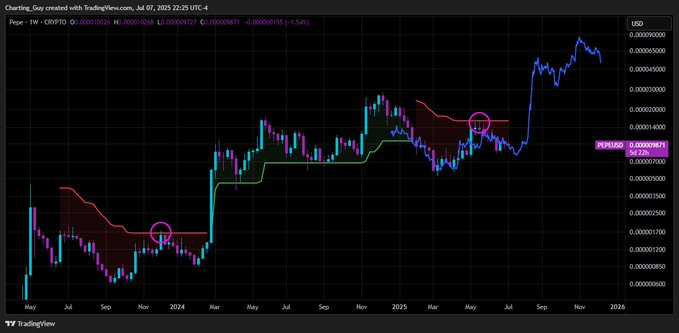
At the time of writing, PEPE meme coin was trading near $0.00000987. Taking the cloud back would be a huge technological victory, particularly weekly. This often precedes trend reversals or strong impulsive moves. The fact that this setup is similar to the recent cycle breakout supports the bullish bias.
Momentum indicators also reflect this optimism. The RSI has been neutral and then surged above 50, implying there is an upside without an overbought state. The MACD line has flattened, indicating waning bearish pressure. The higher the technical alignment, the more the likelihood of an upward move is.
Sentiment and Cycle Timing Align With the Bullish Thesis
Sentiment around PEPE meme coin has begun shifting toward bullishness again. The speculation in social media conversations is increasing, particularly regarding price targets and historical fractals. Traders see the present as a time of ultimate accumulation before the next upsurge.
Furthermore, the crypto market as a whole is indicating its status of rotation into meme coins. Bitcoin and Ethereum continue to range, and lower-cap appetite has risen. This environment historically favors meme coin rallies.
In case the breakout validates above the triangle, the traders anticipate an initial resistance at levels of $0.00001320, then the level of $0.000015. Moreover, there is a possibility of a rally that would shoot the price into the $0.000020 price range amid a euphoric period.
Disclaimer
This article is for informational purposes only and provides no financial, investment, or other advice. The author or any people mentioned in this article are not responsible for any financial loss that may occur from investing in or trading. Please do your research before making any financial decisions.




