
 Puffer
 ZKsync
 Bitcoin
 NEAR Protocol
 Pearl
Pearl Quantus
 Sui
Sui

Key Insights:
- FLOKI price surged 51% in 30 days, confirming a bullish reversal off support.
- Analyst projects a rally to $0.00126, implying an 18X from recent lows.
- Breakout above $0.000095 signals strength as charts align across all timeframes.
FLOKI price surged over 51% in less than a month, triggering bullish signals across multiple timeframes. Analysts see breakouts and strong technical patterns as signs of significant upside potential.
A rally as high as 1,800 percent is being projected if momentum continues. FLOKI traded near $0.000089 when writing, preparing to retest a significant resistance zone.
FLOKI Price Projection Points to $0.00126
FLOKI price has rebounded from a mid-channel bottom. Also, the token is forming the right side of a bullish cup. CryptoELITES have noted that the token has adhered to an upward trendline.
There, every cycle registered new lows. These bottoms always reach Fibonacci levels of 0%, 23.6%, and 61.8% in favor of continuing the trend.
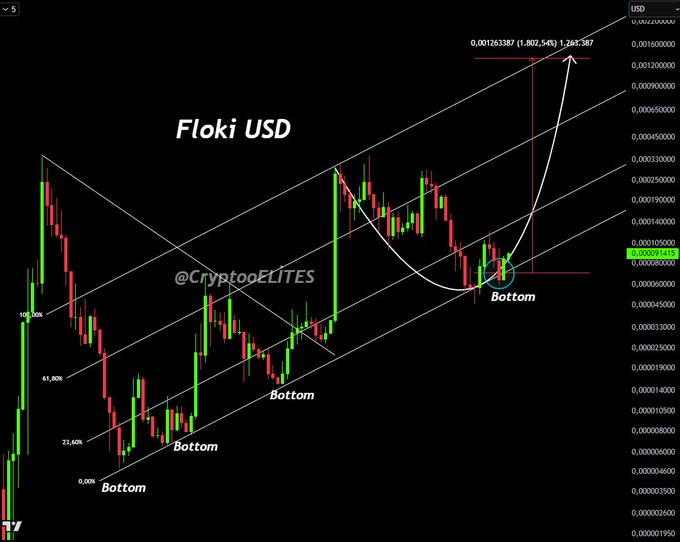
CryptoELITES estimated $0.001263 as a measured move between the lowest support and the highest point in the ascending structure. The chart showed a parabolic projection if the FLOKI exceeds its short-term resistance. This would be an 18 times jump in the present price level.
The pattern affirmed that price has come out of the bottom of the cup and is bending in preparation for a breakout. Analysts expect the rally to continue as long as the FLOKI price remains within the channel. A retest will confirm such a bullish theory to flip to support $0.000095.
Bullish Breakout for FLOKI Price Holds as Resistance Flips
CryptoJobs3 reported the breakout of a long-term downtrend in FLOKI on the 4-hour chart. Price reclaimed $0.000089 and remained above the wedge resistance. The resistance in the short term is between $0.000095 and $0.000097, and the next important level is $0.000110.
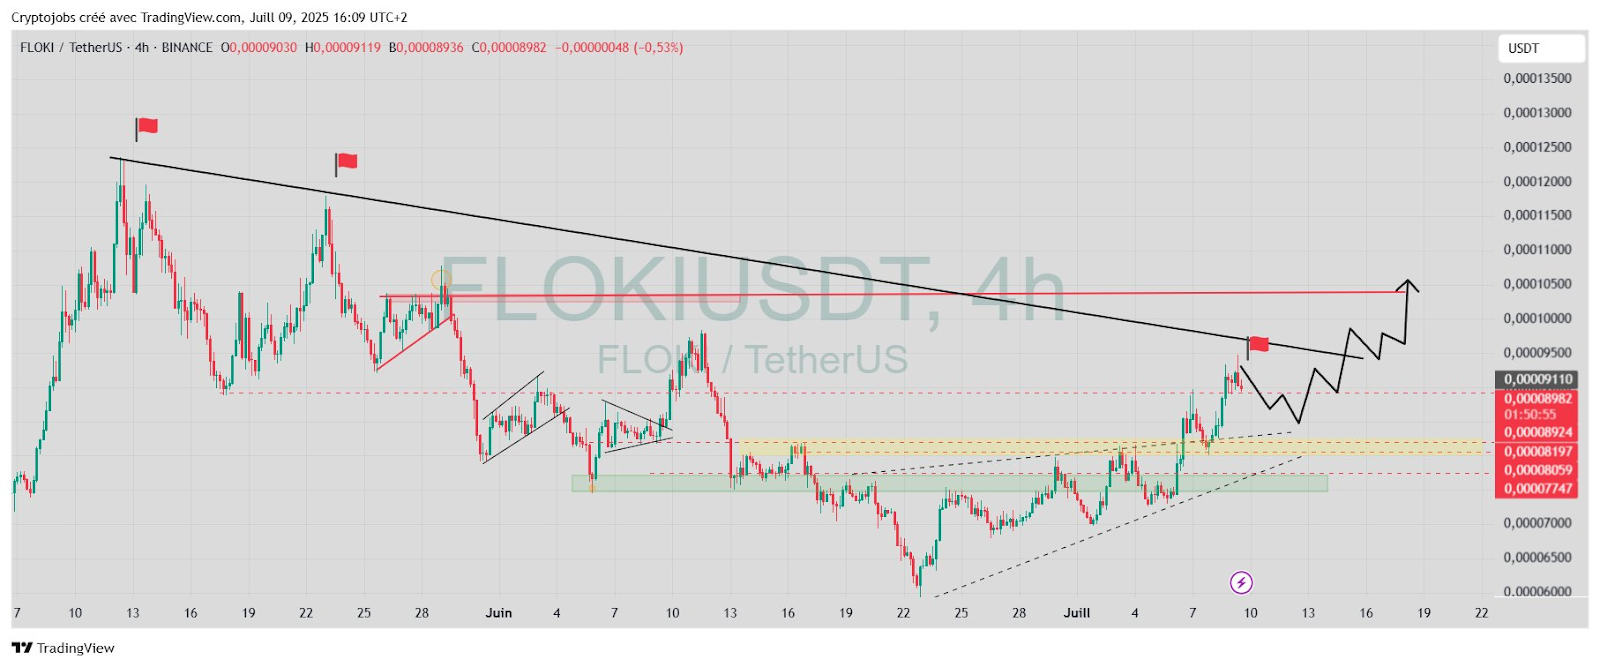
Additionally, support levels to watch include $0.00008620 and $0.00008430. Notably, these areas were good daily closes of previous accumulation. The analyst emphasized that the FLOKI price remains undervalued despite its recent run.
Contrary to technical conditions, lows formed more in the channel’s midline. This indicated impending impulsive action. A clean retest of the descending trendline would help to boost market confidence as bulls gear up for the next breakout.
In this scenario, FLOKI may challenge the $0.000120 zone within days. Volume remains elevated, further supporting the bullish continuation case.
Weekly and Daily Timeframes Confirm Strength
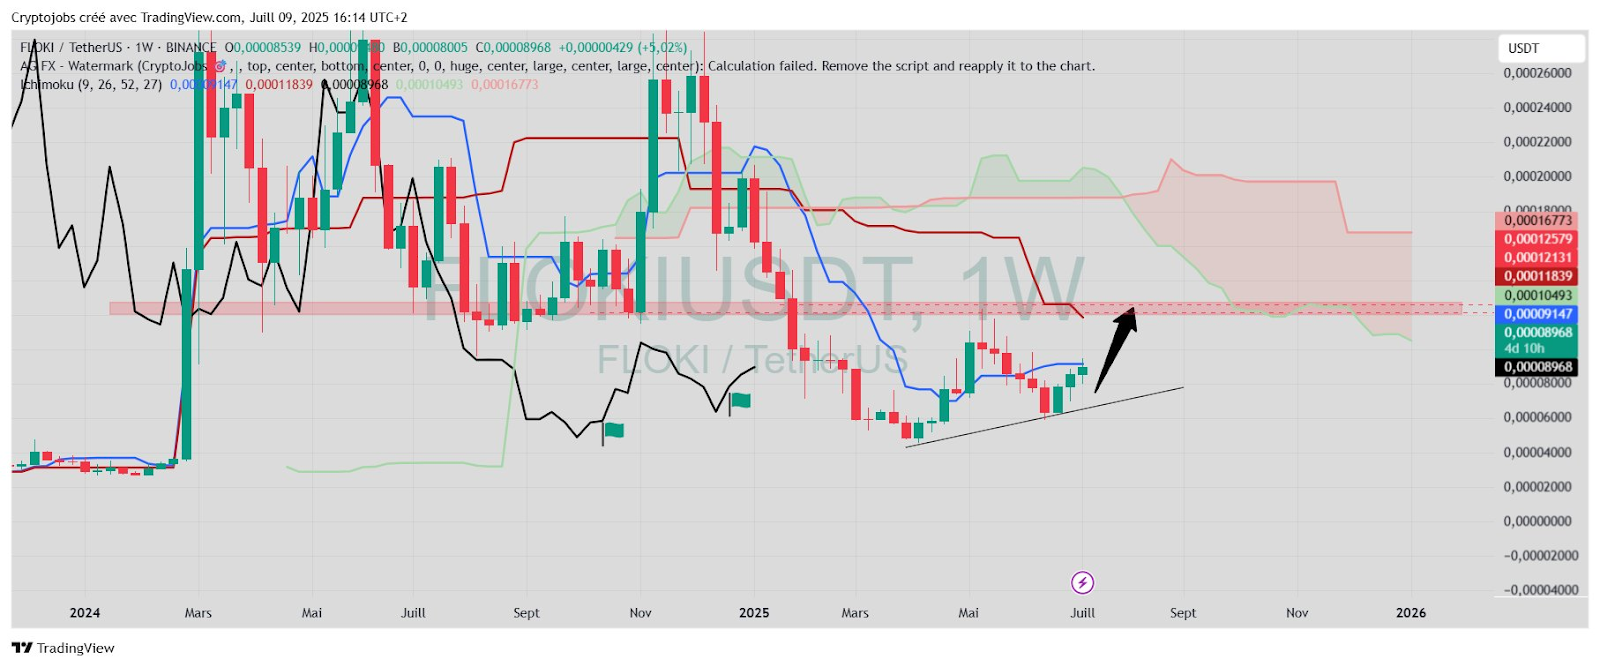
Consequently, on the weekly chart, FLOKI price showed higher lows and a slow approach toward the Ichimoku cloud. The key resistance zone spans from $0.00009147 to $0.00011839.
FLOKI is pressing into this band for the third time in three months. This could be a reversal signal if cleared.
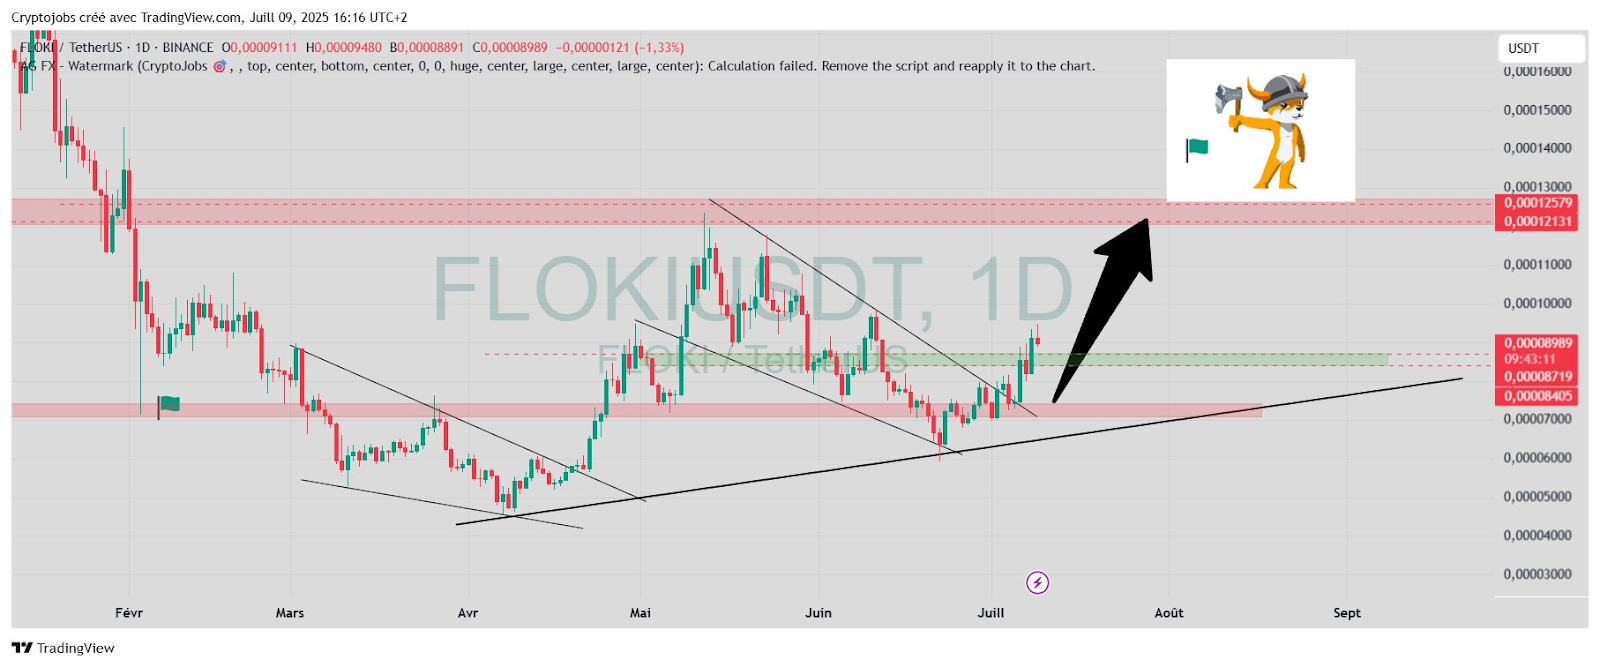
CryptoJob3 mentions that the daily configuration also confirms strength. After consolidating within a falling wedge from May through June, the FLOKI price broke out in early July. The meme coin is now in a historical supply range around $0.00012131 and $0.00012579.
Ichimoku lines are squeezing, and a TK bullish cross is approaching. This setup could create further tailwinds for price expansion. If the macro construction is completed, FLOKI targets above $0.000160 could be actionable.
FLOKI Posts 51% Rally in July
Meanwhile, Coinvo reported that the FLOKI price rose 51% in under four weeks. This breakout follows substantial accumulation near the $0.00006000 region. The rally has created a new support base and renewed the interest of retail traders and meme coin investors.
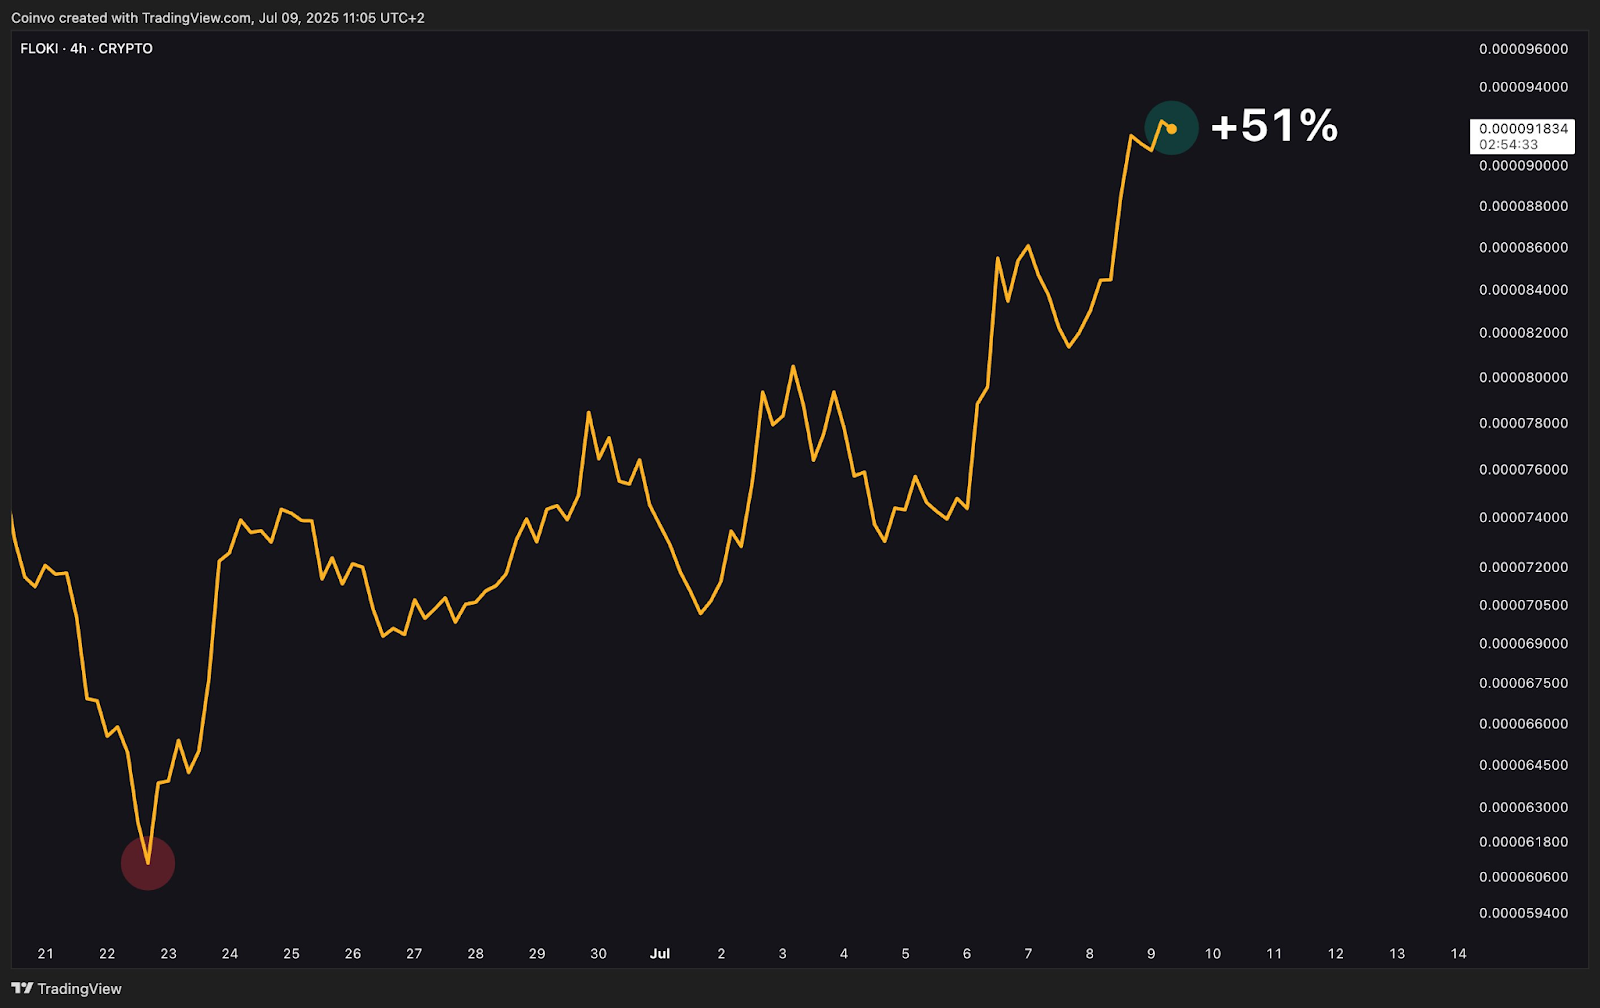
Short-term sentiment has flipped bullish, particularly as FLOKI price now leads performance among meme assets in July. Analysts are monitoring reactions at $0.000095 and $0.000110 to gauge the force of breakouts.
Sentiment data and chain analytics also indicated a surge in the activity of wallets, in particular among small-cap holders. With volume increasing and structure holding, FLOKI price appears well-positioned for further upside.
Disclaimer
This article is for informational purposes only and provides no financial, investment, or other advice. The author or any people mentioned in this article are not responsible for any financial loss that may occur from investing in or trading. Please do your research before making any financial decisions.



