
 Pearl
Pearl Ondo
Ondo Ethereum
 Bitway
 Derive
 Pudgy Penguins
 NEAR Protocol

Key Insights:
- MicroStrategy stock closed at $434.58 after clearing eight-month resistance volume zones.
- According to analysts, cup-handle and megaphone breakouts might propel the price above $1,000.
- Analyst validated a squeeze breakout above $415 in the daily time frame, giving bullish volatility.
MicroStrategy Inc. (MSTR) stock rallied to $434.58 on Friday, gaining over 7.5% and closing above a prolonged resistance zone that capped price action since late 2023. The breakout has triggered fresh optimism among technical analysts, who now see potential for a run toward $500 and possibly $1,000 if current momentum holds.
MicroStrategy Stock Clears Major Resistance
MicroStrategy stock ended the week with a strong close at $434.58, rising 7.57% on Friday alone. The move pushed it beyond a key resistance level that had capped price action since late 2023. The trading volume rose to 18.4 million, which indicated fresh activity as the breakout gained momentum.
According to Gladiator, the stock is now officially above where all its volume was traded in the past 8 months. Volume profile indicates that price has surpassed all the recent high-congestion areas, which may create the opportunity to rise higher. In addition, both MACD and RSI on the daily chart align with the trend change.
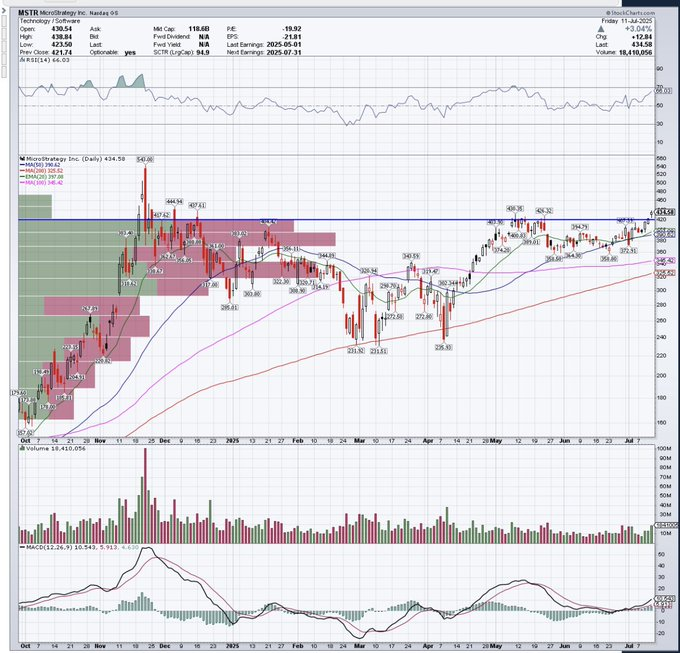
Interestingly, the 50-day and 200-day moving averages are sloping upward in technical momentum. The stock is currently trading significantly above such levels, making it seem bullish to continuing buyers. The next short-term ceiling is at the $450 level, and many traders no longer view it as a barrier but rather as a stepping stone.
Cup-and-Handle and Megaphone Patterns
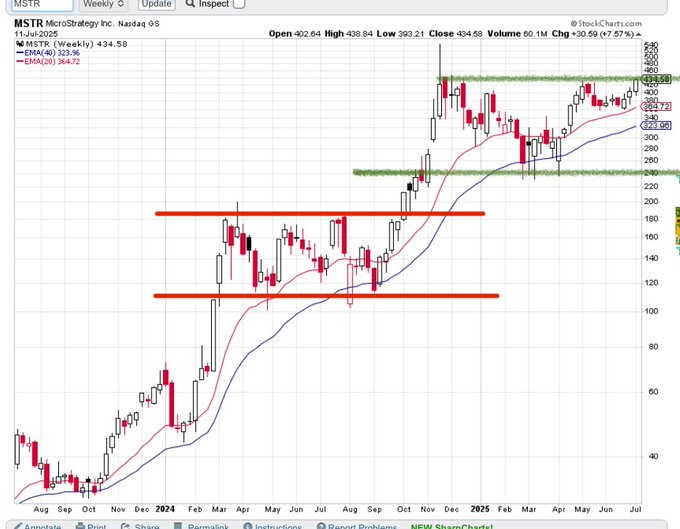
Besides volume structure, analysts have also found overlapping bullish patterns in the Microstrategy stock weekly chart. James E. Thorne identified a textbook cup-and-handle pattern, which has recently been fulfilled. In June, the price broke the handle area and remained upward till mid-July.
BlueMoonTrades also pointed to a widening wedge, or megaphone pattern, that has now resolved to the upside. This uptrend pattern with increasing highs and decreasing lows is a warning of volatility increase.
According to their projection, MicroStrategy stock could “reach $500 very quickly” once the upper trendline breaks, which appears to be underway.
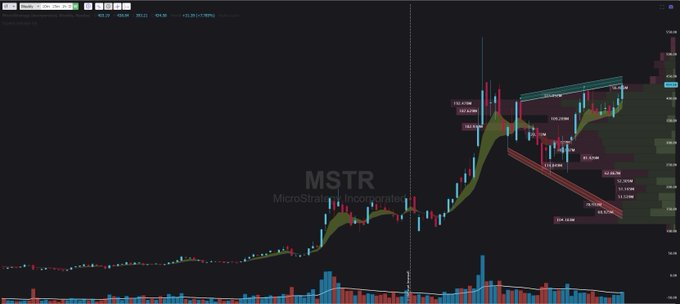
Interestingly, the two patterns indicate a new bullish pattern over time. Price is also trading above major exponential moving averages, including the 20-week and 40-week EMAs. These have acted as dynamic support levels since early 2024 and affirm the trend strength in the long run.
Microstrategy Price Projections Extend to $1,000
With MicroStrategy stock clearing $434, traders are now eyeing aggressive upside targets. Gladiator predicted that the stock will run to $1,000 by the end of July, referencing the recent breakout and void above current price levels on the volume profile.
The company’s exposure to Bitcoin has historically amplified price movements during crypto bull cycles. As Bitcoin trades above $110,000, MicroStrategy is benefiting from renewed institutional confidence in digital assets. Its treasury model and leveraged BTC holdings continue to attract market attention.
More so, the relatively low float and extremely high insider ownership make the stock prone to breakout rallies. During past surges, these factors contributed to rapid vertical movement, especially when volume exceeded 15 million shares per day. The most recent breakout formation resembles the preceding, indicating a risk of a rapid move.
Some analysts consider that $500 is a short-term ceiling, but others state that with good buying pressure, MicroStrategy could go even higher. The absence of resistance between $435 and $520 reinforces this thesis as well.
Analyst Confirms Breakout With Daily Squeeze Signal
In the meantime, TrendSpider indicated a symmetrical cup and handle pattern on the daily chart, where the neckline was broken at $415. The squeeze momentum indicator on the platform has long fired, indicating rising volatility and buyer control.
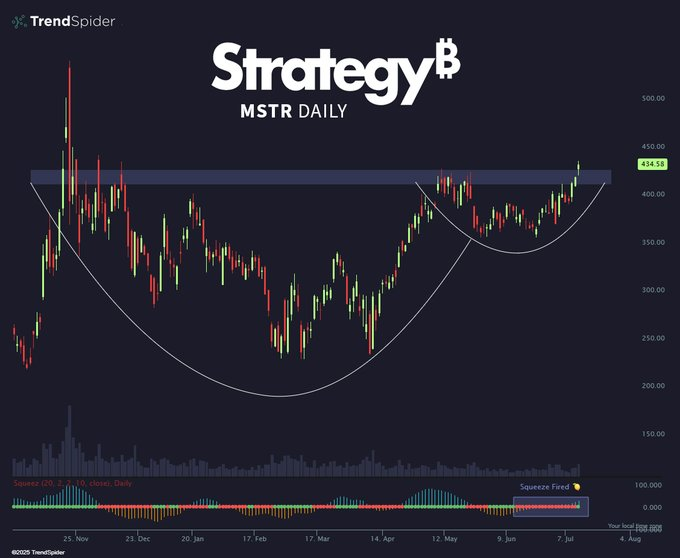
Notably, the signal is commonly considered a precondition of a quick price movement. Volume also expanded during the breakout, aligning with technical expectations. As long as MicroStrategy stock remains above $415, the pattern remains valid and likely to play out.
TrendSpider analysis reflected other technical opinions and provided clarification at the short-term scale. With a clean breakout and even having a supportive squeeze, the chances of further price strength are high. The $450-500 area could become an attraction to late-entry traders.
Disclaimer
This article is for informational purposes only and provides no financial, investment, or other advice. The author or any people mentioned in this article are not responsible for any financial loss that may occur from investing in or trading. Please do your research before making any financial decisions.



