
 Pearl
Pearl Bitway
 Monad
Monad Ondo
Ondo Derive
 Walrus
 Zcash
Zcash
Key Insights:
- Solana price reached a key level of $185 after struggling for almost five months.
- The current level appears to be a make-or-break point for the asset. The last time the price reached this level, it experienced a significant drop.
- SOL’s RSI is in the overbought territory, and on-chain metrics, such as the long/short ratio and spot inflow/outflow, are flashing bearish signals.
After a 40% price uptick, Solana price reached the $185 level. It struggled for almost five months, but now appears difficult to hold. This comes after a nonstop rally lasting over three consecutive weeks. So, now the asset is in a make-or-break situation.
Solana Price at Key Level, Eyes on $185
The potential reasons behind Solana crypto’s struggle to hold this level are the recent $70.97 million SOL inflow, an overstretched price, and historical patterns. In addition, Solana derivatives are also flashing a short-term bearish signal. It indicates a potential price dip in the coming days.
According to the daily chart on TradingView, the asset faced strong selling pressure at the $185 level due to its historical price performance.
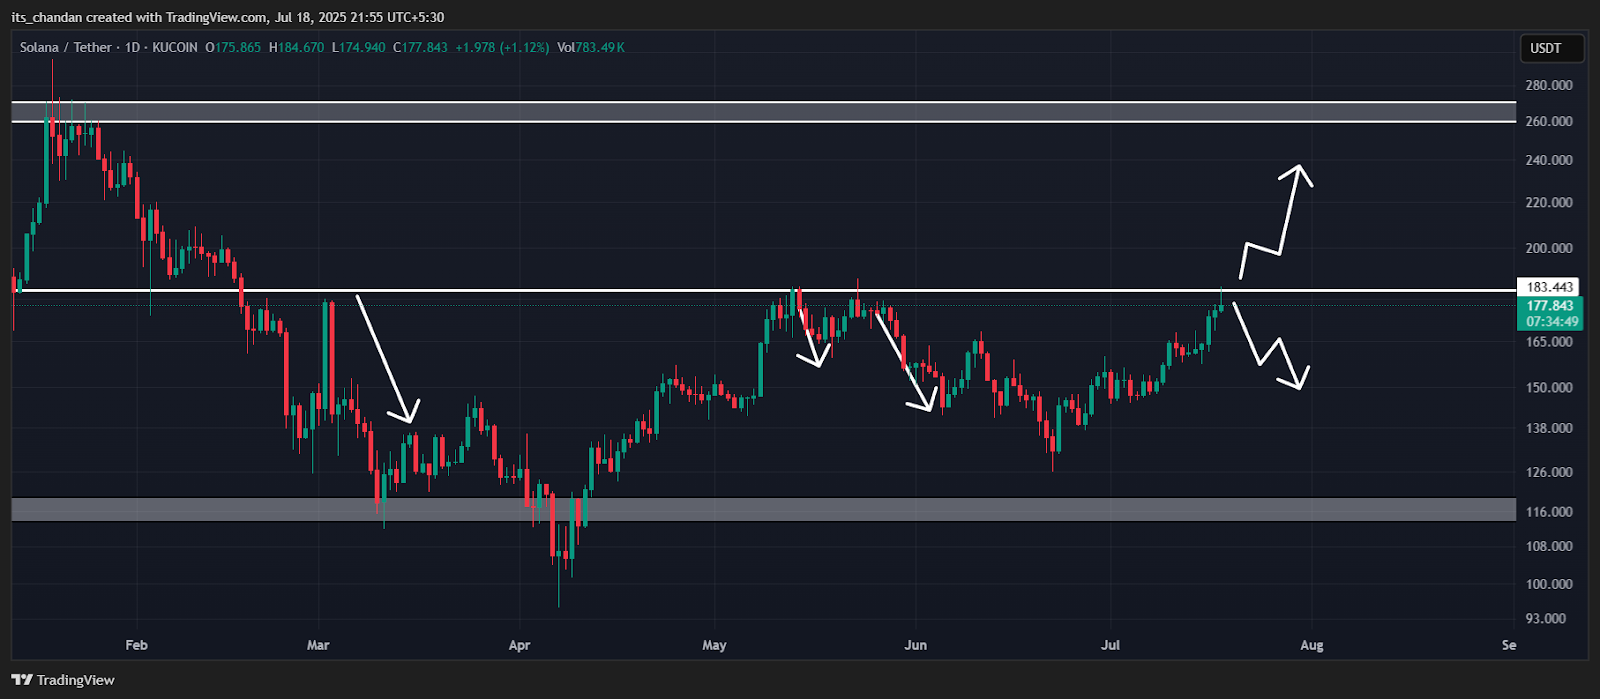
Additionally, in the current market structure, participation from traders and investors at this level has skyrocketed. Some believe that Solana’s prolonged resistance could break this time, while others remain on the selling side.
Solana Current Price and Bearish Derivative
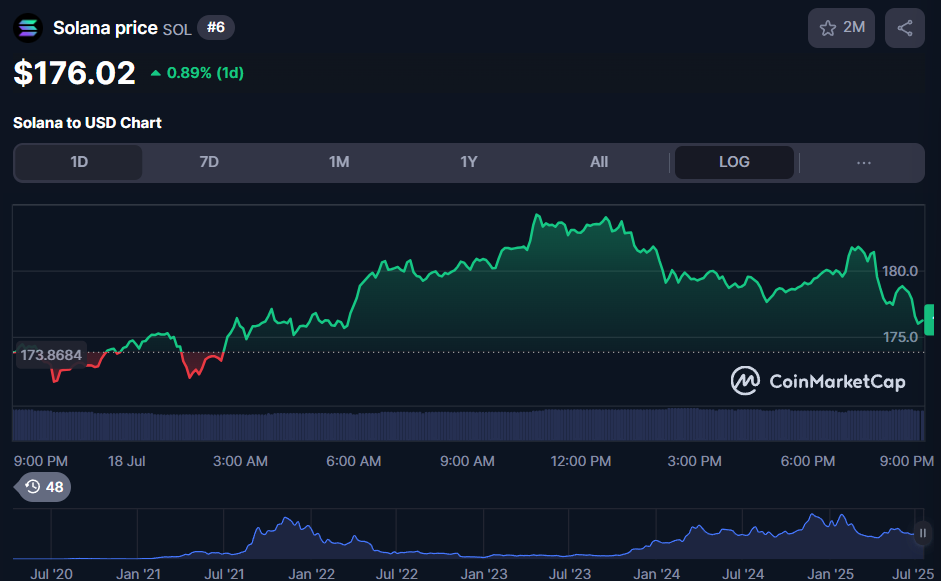
At press time, the Solana price was declining, trading at the $176 level. The asset achieved this level after reaching $184.28 over the past 24 hours, holding a modest gain of 0.90%. During this period, trader and investor participation increased. It resulted in an 11% surge in recorded trading volume.
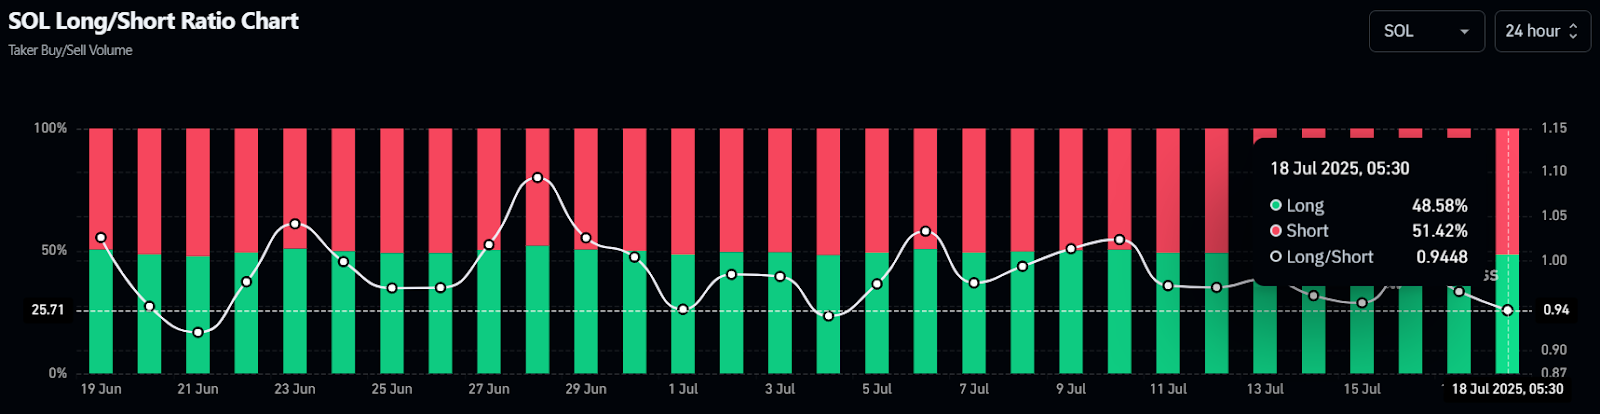
Given the current market sentiment, traders have turned bearish and appear to be strongly betting on the downside, as reported by the on-chain analytics tool CoinGlass.
Data showed that Solana crypto’s long/short ratio stood at 0.94. It indicated a strong bearish sentiment among traders. The major liquidation levels at press time were $174.1 on the lower side and $185.5 on the upper side.
Additionally, traders were over-leveraged, with $151.64 million worth of long positions and $334.55 million worth of short positions.
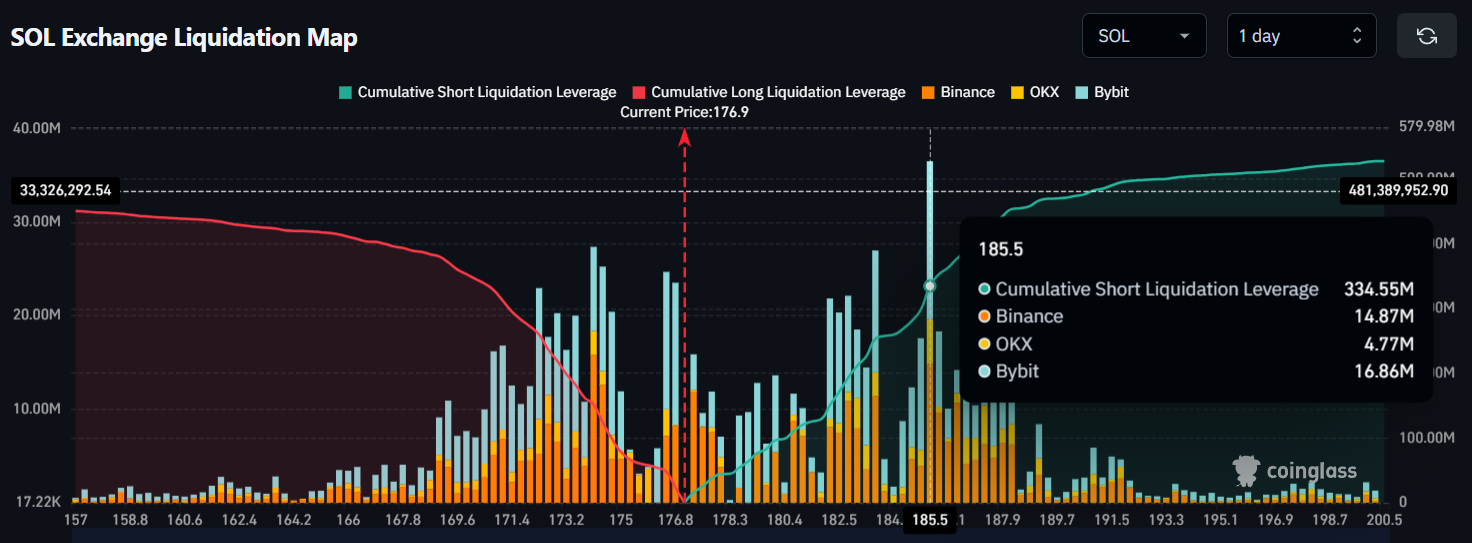
That painted a clear picture of a strong bearish outlook among traders.
Solana Crypto Technical Analysis and Upcoming Level
According to expert technical analysis, Solana crypto is in an uptrend. However, due to its overstretched price and continuous upward movement, the asset is now facing selling pressure.
It began when the Solana price reached a key resistance level of $185 for the third time since May 2025. Historically, whenever the asset has reached this level, it has always registered a price dip and downside momentum.
It raises concerns about whether Solana will maintain its uptrend or end it without closing a daily candle above the $185 level.
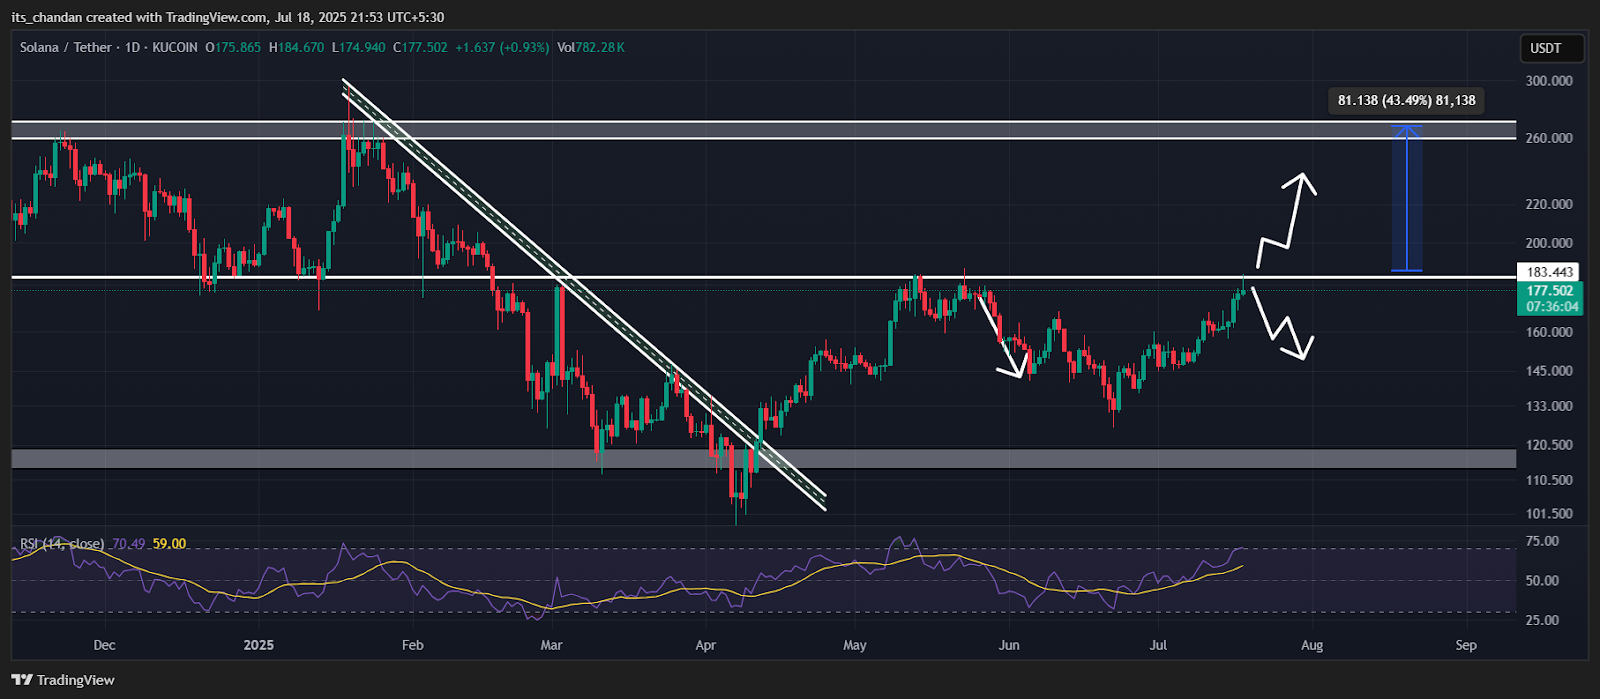
Based on recent price action, Solana’s rally could only continue if it breaks out of this prolonged resistance and closes a daily candle above the $185 mark. If this occurs, it could pave the way for a 40% price increase, potentially pushing SOL to the $270 level.
On the other hand, if sentiment shifts and the ongoing momentum persists, there is a strong possibility that history may repeat itself. When writing, Solana’s Relative Strength Index (RSI) was at 72. It indicated that the asset was in overbought territory.
Whenever an asset’s RSI enters the overbought zone, it signals a potential price reversal, correction, or price drop. However, if the asset is in an uptrend, this correction can potentially bring renewed upside momentum.
Disclaimer
This article is for informational purposes only and provides no financial, investment, or other advice. The author or any people mentioned in this article are not responsible for any financial loss that may occur from investing in or trading. Please do your research before making any financial decisions.



