
 Pearl
Pearl Bitway
 Zcash
Zcash Walrus
 Aerodrome Finance
 Starknet
 NEAR Protocol
Key Insights:
- HBAR still has a potential 43% upside, which could only materialize if the asset maintains support above the $0.26 level.
- Hedera (HBAR) ranks 2nd in core protocol developer activity among all Layer 1 networks.
- A crypto expert made a bold prediction, stating that the HBAR candle is no longer on fire and a bearish divergence has formed.
HBAR has registered a notable 3.75% dip over the past 24 hours along with the major cryptocurrencies. It reached a crucial support level at $0.26.
At press time, the asset is hovering near $0.264. Meanwhile, investor and trader participation dropped significantly by 30% during the same period.
HBAR Price and Expert Bold Prediction
Besides the overall market sentiment, potential profit booking is another reason for the persistent HBAR price decline. A halt in altcoin momentum, an almost 80% rally over the previous month, and an increase in Bitcoin‘s dominance came next. It has reached 60.73%.
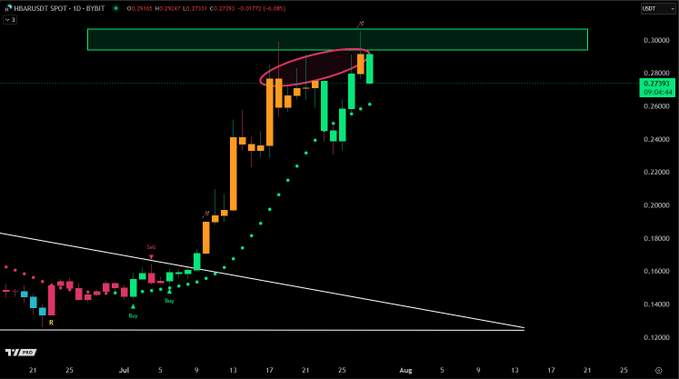
Given the current market sentiment, a well-followed crypto expert shared a post on X (formerly Twitter). The analyst stated that HBAR’s candle is no longer on fire. He further noted that the asset has formed a bearish divergence on the daily chart, indicating potential downside momentum.
Hedera (HBAR) Price Action and Technical Analysis
According to expert technical analysis, HBAR is in an uptrend. However, it appears to be undergoing a correction due to an overstretched price.
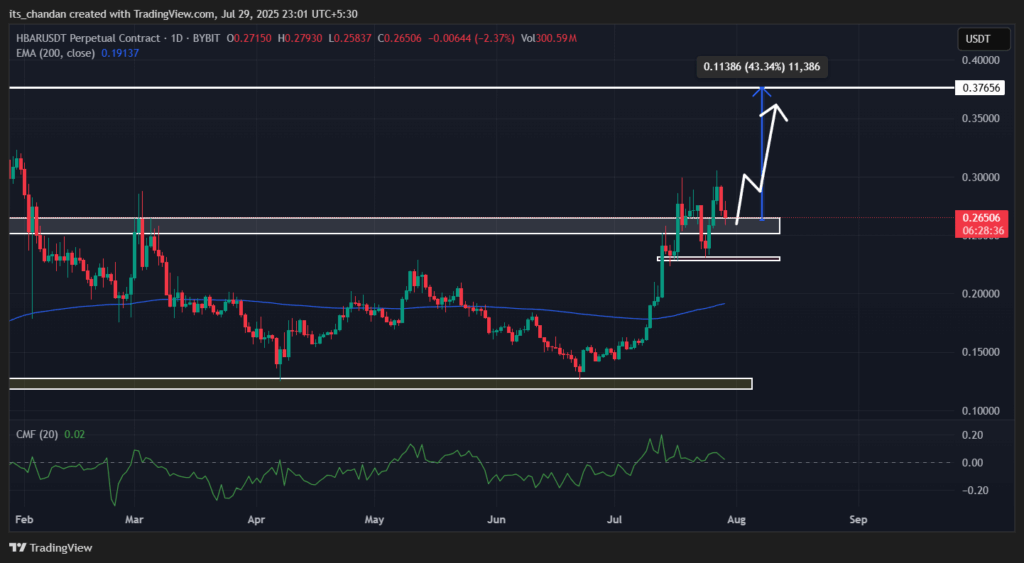
Per the daily chart, the asset has also formed a bearish divergence. This occurred when the HBAR price increased while the momentum indicator, Relative Strength Index (RSI), formed a lower low. This combination signals a potential bearish reversal and hints at a possible dip ahead.
Based on recent price action, the asset could experience a 13% downside move. This could be seen if this momentum continues, reaching the $0.227 level.
On the other hand, sentiment may shift, and the price may hold near the $0.26 level. There is a strong possibility of a price reversal from that point.
HBAR’s Chaikin Money Flow (CMF) stood at 0.01 at press time. This indicates minimal market buying or selling pressure, suggesting a neutral sentiment among traders.
$6.37 Million HBAR Outflow from Exchanges
Investors and long-term holders have persistently accumulated HBAR tokens despite the bearish outlook.
Coinglass data revealed that exchanges have seen consistent outflows of HBAR over the past four trading days. In the last 24 hours alone, approximately $6.37 million worth of HBAR tokens have been withdrawn from exchanges.
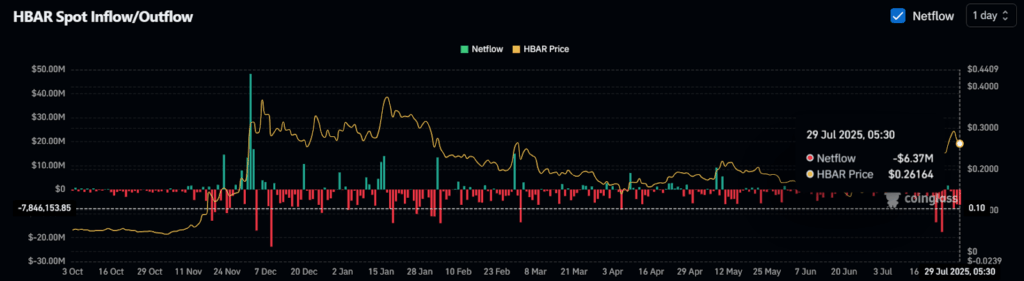
This continuous outflow suggests ongoing accumulation by holders. This could reduce selling pressure if the trend continues.
Traders Continue Bets on Short Positions
However, traders, conversely, appear to be heavily betting on short positions. Coinglass data reveals that HBAR’s long/short ratio has dropped to 0.83, the lowest since late June 2025. This indicates strong bearish sentiment among traders.
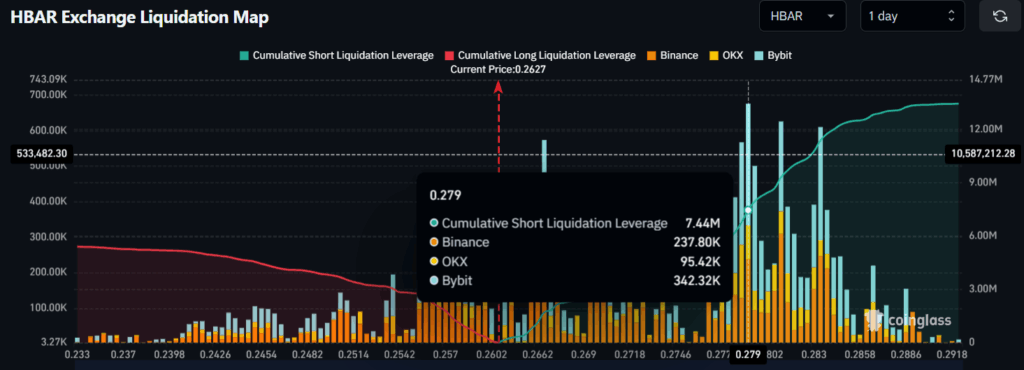
The data shows that 45.61% of traders hold long positions, while 54.39% are short. At press time, the primary liquidation levels are $0.257 on the lower side and $0.279 on the upper side.
At these levels, traders have built $1.80 million worth of long positions and $7.44 Million worth of short positions.
When combining these on-chain metrics, the short-term market outlook remains bearish, while the long-term perspective is still bullish.
The latest data shows that HBAR ranks second in core protocol developer activity among Layer 1 networks, scoring 126. This places Hedera ahead of Chainlink, Cardano, Polkadot, and others.
Disclaimer
This article is for informational purposes only and provides no financial, investment, or other advice. The author or any people mentioned in this article are not responsible for any financial loss that may occur from investing in or trading. Please do your research before making any financial decisions.




