
 Bunker Mode
 Bitcoin
 Pearl
Pearl Starknet
 NEAR Protocol
 Wormhole
 Quantus

Key Insights:
- Shiba Inu crypto broke below a rising wedge on the 4-hour chart, typically signaling a bearish continuation. Its downside target is under $0.00001280.
- The RSI is declining below neutral (38.37), showing sellers dominate as SHIB fails to reclaim bullish levels.
- SHIB is testing key support near $0.00001300; if breached, historical corrections suggest a retest of $0.00001200 is possible.
Shiba Inu crypto (SHIB) is already demonstrating a persistent bearish condition as it has fallen through an important rising wedge formation on the 4-hour time-frame chart.
The meme coin, previously supported by a short-term bullish extravaganza earlier in July, has started marching downhill. The number of bearish signals prevailing now easily surpasses the short-term bullish signals.
The continued drop is in a textbook breakdown pattern of a rising wedge. In most cases, we would be expected to work as a continuation in a bear market scenario.
The rising wedge most likely started to form in the middle of July. Shiba Inu crypto price broke this wedge on July 22. The price went down to reach a level of close to 0.00001330 and leveled off afterward.
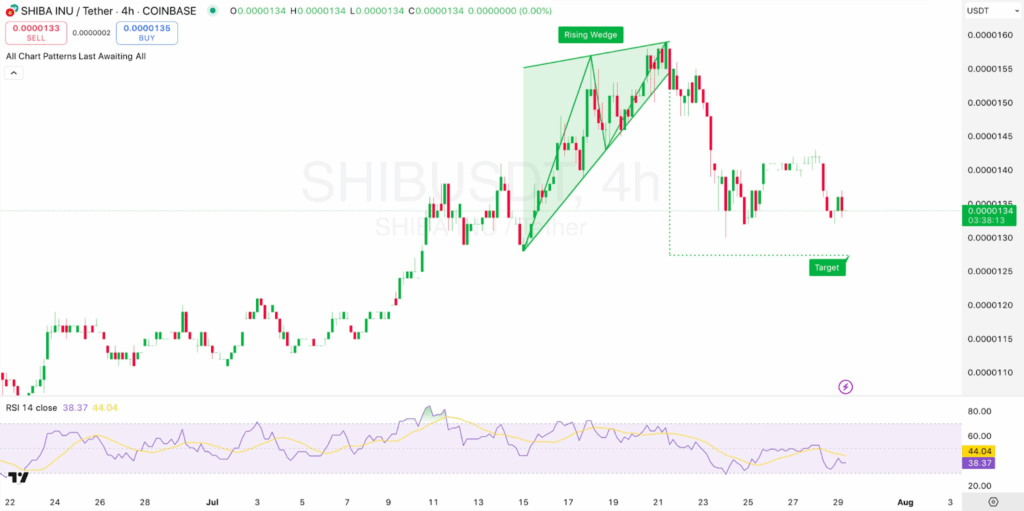
The Relative Strength Index (RSI) in the 4-hour period was also declining. It was already 38.37, and the trend of the indicator was downward. That indicated the loss of momentum and growing chance of further price decline.
The RSI has not been able to reverse above the neutral 50 mark in the recent consolidation trend. It is a sign that sellers are yet to give up.
Shiba Inu Crypto Prices Struggle
CoinMarketCap stats show that SHIB has lost over 4% value as of press time.
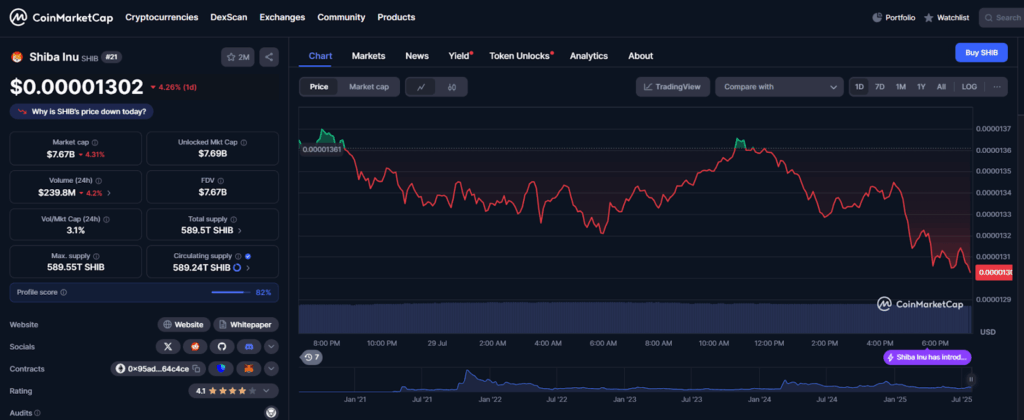
The volume to market cap ratio of 3.1% shows systemic trading interest is low, considering the size.
Shiba Inu Crypto Approaching Historical Support Zones
On a different chart, SHIB was trading slightly above a historical support area in the vicinity of 0.00001250 to 0.00001300.
This support zone has already served as a launchpad of rallies, as was the case with various bounces since the beginning of 2023. However, the price movement now reveals that SHIB is retesting this region as the market is uncertain.
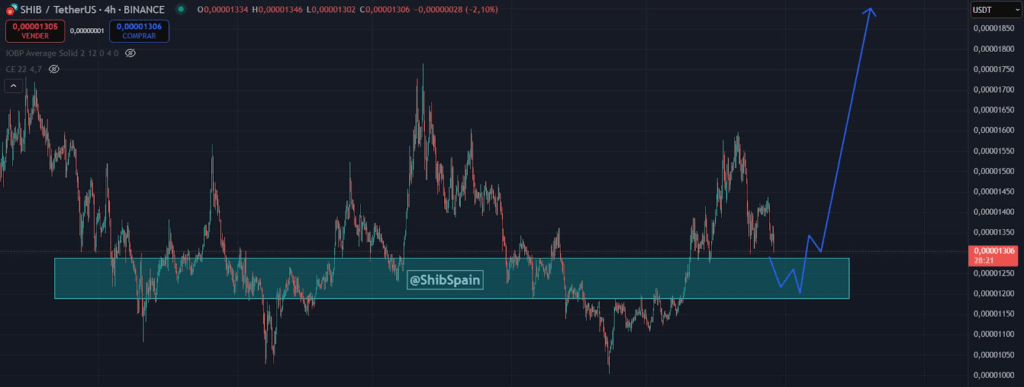
With this support breaking down, SHIB may witness a retest of the $0.00001200 level, to which it had encountered corrections in the past.
The chart displays a potential recovery situation. It is in this form that Shiba Inu crypto could temporarily scatter within the range and make a subsequent charge up to the potential of reaching the levels of $0.00001800 again.
However, this bullish action will be dependent on the healthy buy volume going back into the market. However, this is not yet evidenced by the current indicators of the momentum.
Even after the initial strength at around the $0.00001330 position, SHIB has yet to present the bearish reversal needed to undercut the bearish sentiment. The recent chart provides a possible reversal within the support zone. Still, there are no main indicators that have signaled to think so.
To reverse any bullish trend, the Shiba Inu crypto would require it to break above the previous wedge support and revalue the range of $0.00001450-0.00001500 with high volume.
Disclaimer
This article is for informational purposes only and provides no financial, investment, or other advice. The author or any people mentioned in this article are not responsible for any financial loss that may occur from investing in or trading. Please do your research before making any financial decisions.




