
 Pearl
Pearl Bitway
 Pons
Pons Sui
Sui Quantus
 Doge Pepe
 Bitcoin
Key Insights:
- On the daily chart, Bitcoin has formed a bearish divergence and a strong bearish engulfing candle. This suggests potential downside momentum.
- A crypto expert shared a post on X, noting that the BTC price may fall to $92,000. This happened as it moved in a higher-high, higher-low pattern.
- $351 Million worth of BTC long positions are at risk of liquidation.
Bitcoin (BTC) appears to be losing control of its upside momentum following the release of US PPI data. This came in at 3.3% higher than expected.
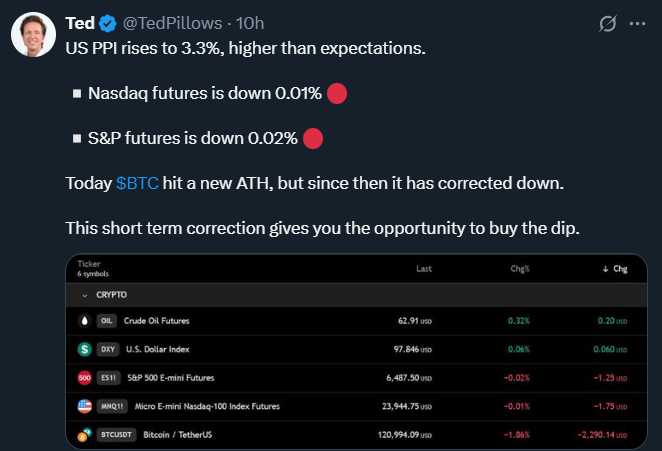
This surge in the US PPI has impacted the crypto and other financial markets. It resulted in data that lowered Nasdaq and S&P futures by 0.01% and 0.02%, respectively. A well-followed financial expert revealed the same.
Current Bitcoin Price Dip and Rising Trading Volume
On X, the expert shared PPI data alongside the all-time high of Bitcoin and its sudden correction. The expert noted this is a short-term correction given the current market sentiment.
This may present an opportunity to buy the dip. So far, BTC price has slipped over 4% in the past 24 hours and currently stands at $118,200.
This sudden fall after registering an ATH has prompted traders and investors to show a strong interest in the asset. This resulted in a 20% surge in the trading volume recorded compared to the previous day.
Bitcoin Price Technical Analysis
However, this sudden fall has triggered a bearish sentiment in the crypto market. According to expert technical analysis, the daily chart of Bitcoin shows a bearish divergence pattern.
It’s a pattern where the price appears to make higher highs. At the same time, the momentum indicator, the RSI, forms lower lows, suggesting that momentum is fading.
In addition, the asset’s daily chart shows a large red candle that engulfs the past three days’ candles. This further strengthens this bearish outlook.
However, the price currently faces a strong local support level. It appears to hold back BTC’s downside momentum.
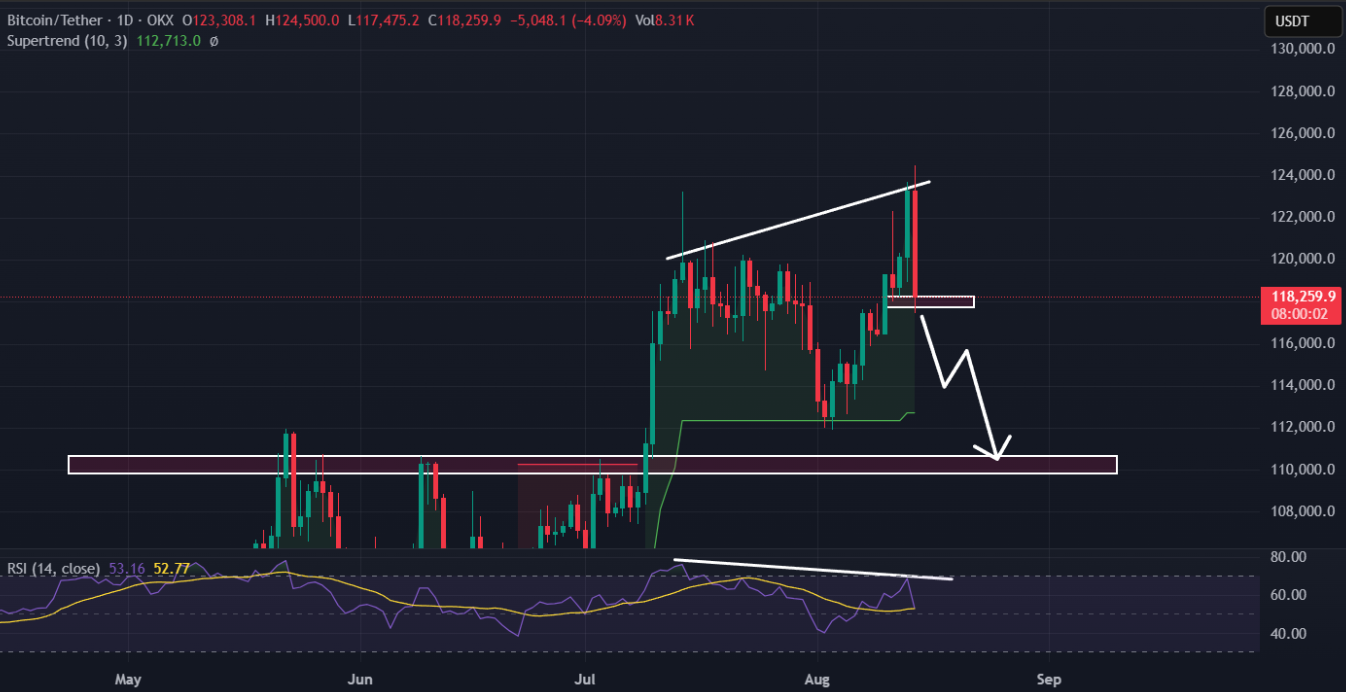
Based on recent price action and historical patterns, BTC has retested this level for three days. Each time it has recorded upside momentum. Given the current market conditions, this level now appears to be a make-or-break point for Bitcoin’s price.
On the daily chart, Bitcoin could gain further upside momentum if it sustains above the $117,900 level. If the asset fails to hold this level, BTC could experience a sharp decline of over 6%. Moving ahead, it could reach the $110,000 level.
Despite the mixed sentiment, the technical indicator Supertrend shows a bullish signal, remaining green and positioned below the Bitcoin price. This suggests that upward momentum could continue, and the asset may target higher resistance levels soon.
Expert Bold Price Prediction
Amid this crucial moment, a well-followed crypto analyst shared a post on X making a bold prediction. The post included a weekly chart showing that the asset forms higher highs and lower lows.
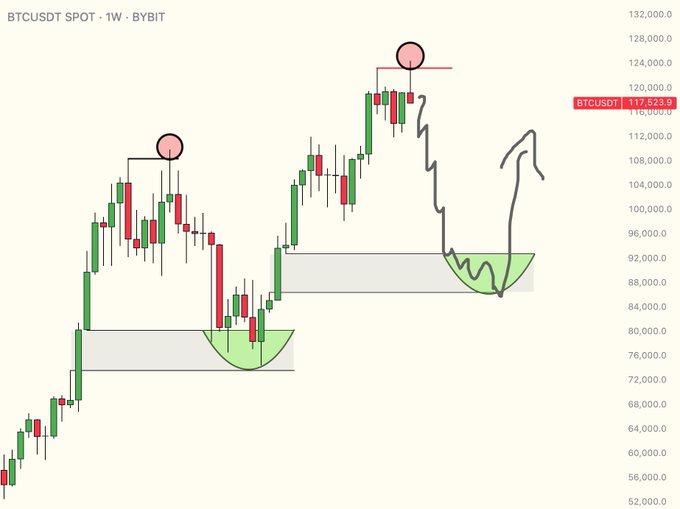
Currently, the price is at a higher high and appears to be heading toward a higher low. According to the post, the expert predicts that Bitcoin could fall to the $92,000 level.
$351 Million Worth of Bitcoin on Verge of Liquidation
At press time, trader sentiment has shifted toward the bearish side, with bets on short positions rising significantly. Coinglass data highlights key Bitcoin liquidation levels. The lower level is $117,175. The upper level stands at $119,550.
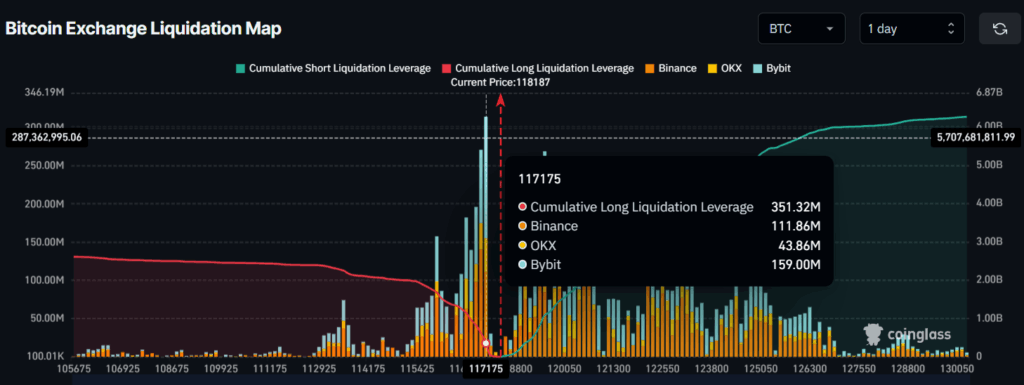
Additionally, traders at these levels are over-leveraged. They hold $351.32 Million in long positions and $1.09 Billion in short positions. This indicates strong bearish dominance.
This data makes it clear that bears are firmly in control. Also, $351 Million worth of long positions are on the verge of liquidation. This happened as the price approached the $117,175 level.
Disclaimer
This article is for informational purposes only and provides no financial, investment, or other advice. The author or any people mentioned in this article are not responsible for any financial loss that may occur from investing in or trading. Please do your research before making any financial decisions.





