
 Bitcoin
 NEAR Protocol
 Pudgy Penguins
 Puffer
 ZKsync
 Bitway
 Pearl
Pearl
Key Insights:
- HBAR price is targeting $0.55 in case the bull flag breaks above the major resistance.
- MACD Golden Cross formation, an indicator of a momentum change that may trigger a breakout.
- The Elliott Wave count signified additional gains with resistance turning to new support.
HBAR price has been consolidating in a bullish technical structure that may indicate an imminent breakout. Analysts noted confirmation levels formed at Fibonacci support levels and momentum indicators indicating a reversal. In case these signals align, the top altcoin may rally to $0.40 and extend to $0.55.
HBAR Price Supported by Bull Flag Formation
ChartNerd identified a clear bull flag formation on the HBAR daily time frame. The pattern implied the breakout target of $0.55. Notably, the analyst emphasized that the bullish sentiment can only be confirmed provided that the support at $0.21 remains strong. This level corresponds to the 0.382 Fibonacci retracement level and offers a structure to buyers.
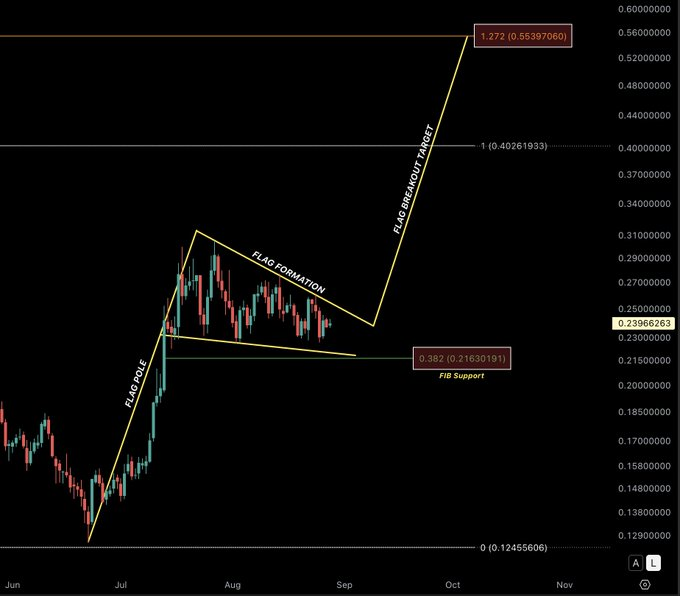
Remarkably, the bull flag formation commenced with a strong flagpole in June, followed by sideways price action in July and August. The flag was created in the consolidation to form downward sloping resistance lines.
Interestingly, a breakout above this would initially force HBAR price to move to $0.402 and then to the full measured target of $0.553. However, a loss of $0.21 would indicate a sign of weakness and may invalidate the bullish structure.
MACD Golden Cross Could Confirm Momentum Shift
Besides flag formation, ChartNerd noted that the daily MACD indicator was rising. The MACD and signal line were converging to a potential Golden Cross. This crossover is generally an indication of bearish strength that is being changed to bullish.
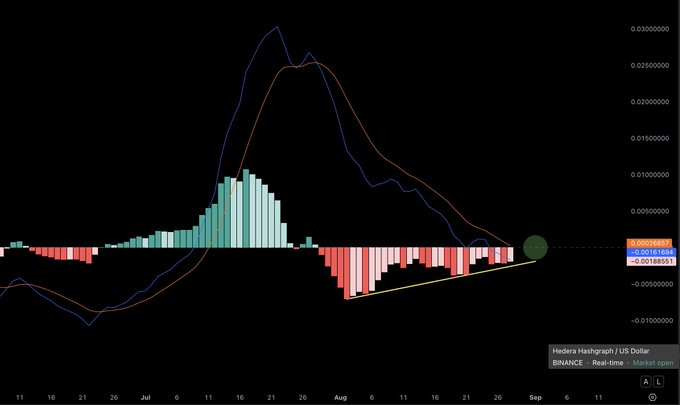
Conversely, the size of the MACD chart histogram bars has decreased, showing diminishing selling pressure. The closer the bars are to neutral territory, the higher the probability of momentum crossover.
However, a verified Golden Cross would serve to reinforce the bull flag breakout and render the projections to the upside viable. Confirmation of momentum is often required when price patterns approach breakout levels.
Bullish Triangle and Network Upgrade Add to Outlook
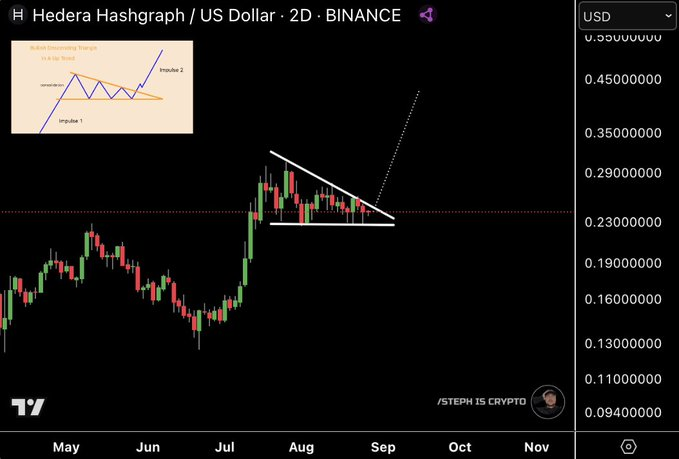
Furthermore, Steph noted another bullish trend on the 2D chart. The analyst stated that Hedera‘s price formed a bullish triangle, a continuation pattern frequently resulting in an upward trend. The triangle’s apex indicated tightening price action likely to break upward to $0.30 and beyond.
In accordance with the technical outlook, Hedera reported its testnet upgrade to v0.65 on August 28. Although the upgrade will be disruptive in the short term, it shows a steady network improvement. Continued growth is a good aspect of long-term investor confidence.
Elliott Wave Analysis Indicates Long-term Rally
In the meantime, Hov offered a general market outlook based on Elliott Wave theory. His analysis revealed that Hedera price has taken three impulsive waves since the last low. The token may be shaping a corrective fourth wave and then continue to rise.
Should it be true, the fifth wave would propel HBAR price far upwards.
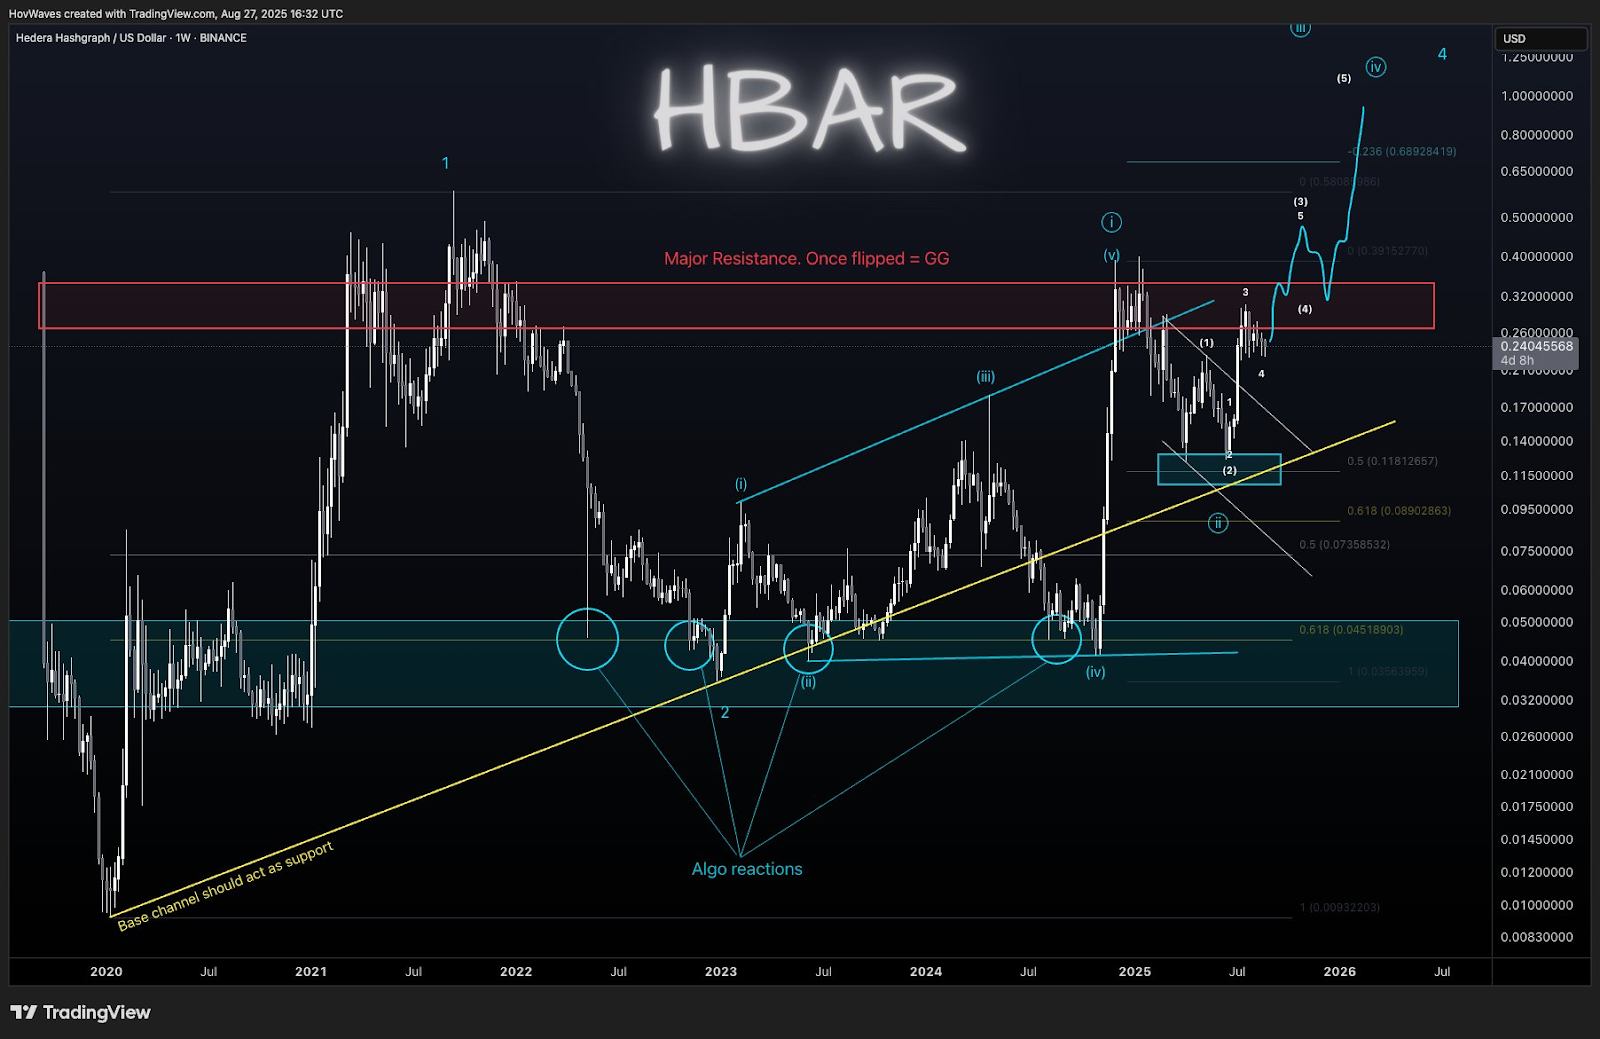
Notably, Hov observed that the HBAR price had already rebounded by over 100% following its recent retest of support levels. A successful crossing over short-term resistance areas may generate strong momentum. The potential upside targets were projected to be at $0.65 in the medium term and $1 in the long-term target. Nonetheless, the analyst warned against entry resistance areas.
So, this analysis showed the role of timing in market positioning. The traders interested in making entries are encouraged to respect corrective structures. In resistance testing, Hov said that patience is essential since wave formations usually must consolidate before reaching higher heights.
Thus, The Elliott wave approach aligns with other positive indicators and projects bullish continuity after resistance.
Disclaimer
This article is for informational purposes only and provides no financial, investment, or other advice. The author or any people mentioned in this article are not responsible for any financial loss that may occur from investing in or trading. Please do your research before making any financial decisions.



