
 Pearl
Pearl Bitway
 Pudgy Penguins
 Quantus
 Walrus
 Quant
Quant Artificial Superintelligence Alliance

HBAR price has pulled back and moved into a bear market after falling by over 27% from its highest level this year. This mirrors the performance of most cryptocurrencies.
Hedera price has formed a bullish flag pattern, signaling potential upward momentum. The current pullback may be short-lived as it’s in the second phase of the Elliott Wave.
HBAR Price Has Formed a Bullish Flag Pattern
The daily timeframe chart shows conditions are ripe for a strong bullish breakout in the coming weeks. One of the most bullish catalysts is that the coin has found support at the 200-day Exponential Moving Average (EMA).
This has provided it with substantial backing since July 10 this year. HBAR price is in the process of forming a bullish flag pattern. This pattern comprises three key aspects, as seen in the chart below. First, it has formed a descending channel since July 19.
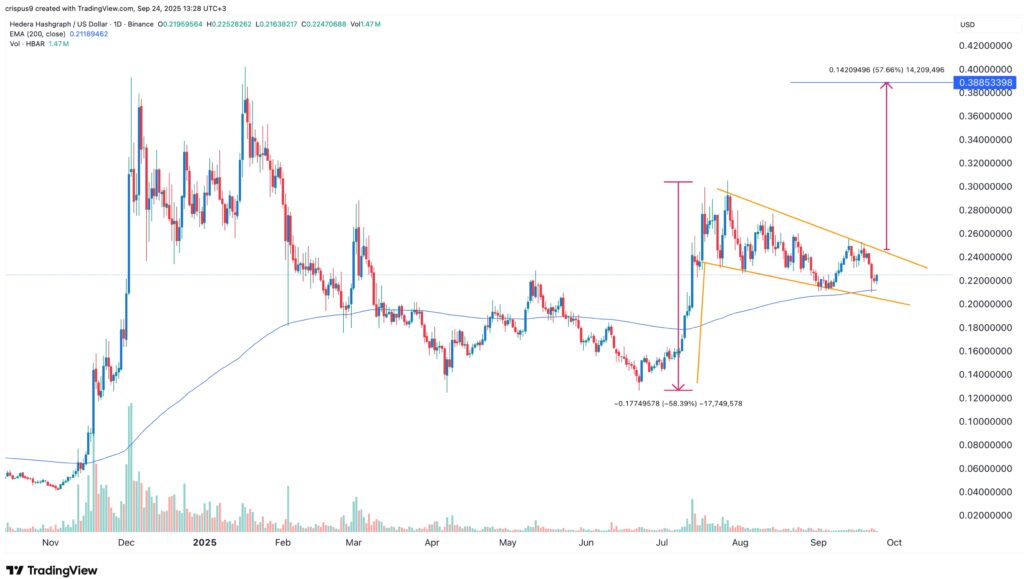
Second, the coin has formed a vertical line, resembling a flagpole. The height of this pole is about 57%. Third, as the chart shows, the volume has been in a downward trend during the formation of the flag section.
Therefore, measuring the same distance from the potential breakout point signals that it will rebound. It could also reach a high of $0.3885, coinciding with the highest point in January this year.
HBAR Price Elliot Wave Analysis
Meanwhile, there are signs that the Hedera price is in the second phase of the Elliot Wave pattern. The Elliot Wave is a technical concept that identifies five stages an asset goes through during a bull run.
The first stage is usually bullish; in this case, it started in June and ended in July. The second phase of the impulse wave is typically a pullback, which must not retrace the first one 100%.
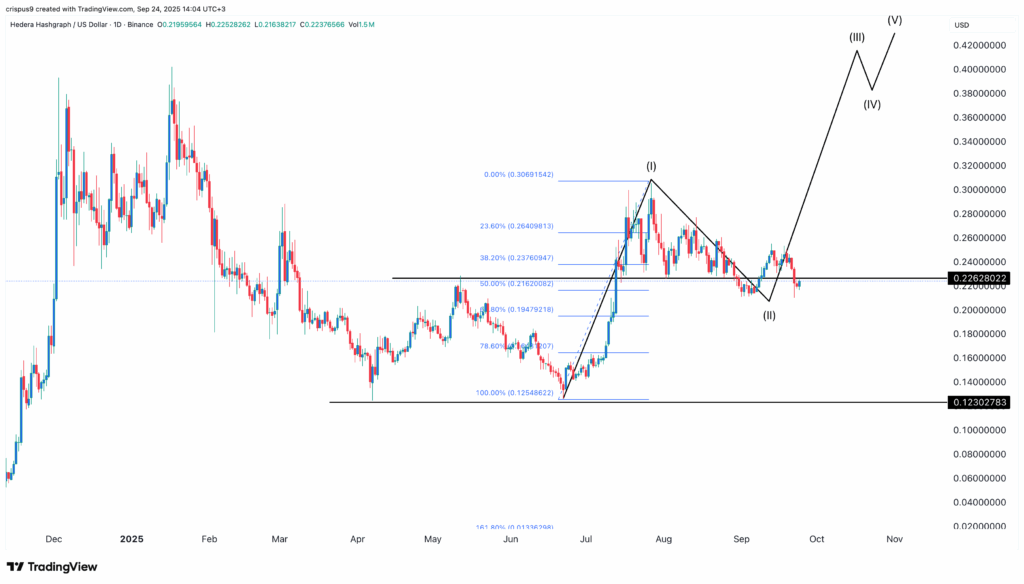
In most cases, this pullback usually retraces between 50% and 61.8%, which happened with HBAR. Therefore, the coin will likely rebound as it moves to the third phase of the Elliot Wave. It is usually the most bullish and the longest.
On top of this, the coin has formed a break-and-retest pattern by falling to $0.2262, its highest level in May. This is the neckline of the double-bottom point at $0.1230. Therefore, the HBAR price will continue rising as bulls target the critical resistance level at $0.40.
Liquidations Falling, Funding Rate is Positive, and HBAR ETF is a Catalyst
Hedera price has numerous bullish catalysts that will push it higher in the coming weeks. First, there are rising odds that the SEC will finally approve the Canary HBAR ETF in October.
Besides, based on the recent ETF guidelines, the agency will fast-track filings with a regulated Coinbase futures product. Hedera is one of the 15 coins that meet the criteria. Also, it is a large, made-in-the-USA coin that is highly liquid and one that the agency has never labeled as security.
Second, Coinglass data shows bullish liquidations have eased after soaring to a multi-month high of $4.26 million on Monday. Liquidations dropped to $106,000 on Tuesday and $278,000 on Wednesday. This decline could encourage more investors to buy the dip.
More data showed that Hedera’s weighted funding rate has remained green on all days since August 25. The funding rate reflects fees paid by traders in perpetual futures contracts. Bulls and bears pay these fees depending on market conditions.
Its purpose is to keep spot and futures prices closely aligned. A positive funding rate is considered highly bullish. It shows investors expect future prices to rise above current levels.
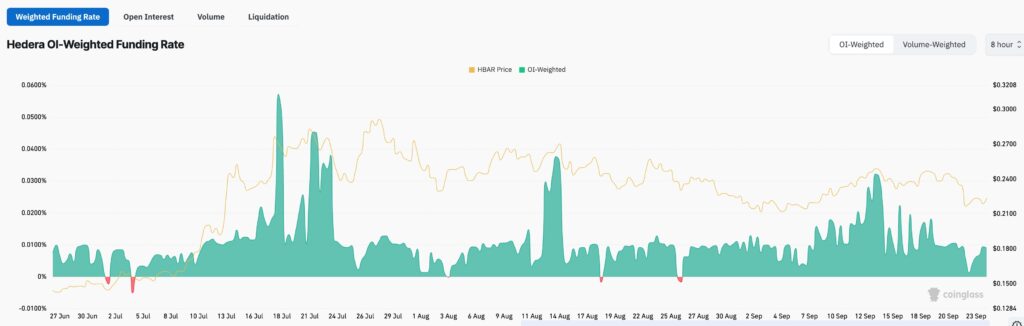
Overall, the HBAR price shows strong technical indicators on the daily chart. There’s growing optimism around potential ETF approval. Bullish signals in the derivatives market suggest further price gains ahead.



