
 Pearl
Pearl Zylo Ecosystem
 Bitway
 Derive
 Walrus
 Quantus
 Pudgy Penguins

Solana price has formed a massive bear flag, hinting at possible bearish waters ahead. Data from the weekly chart shows the Solana price trading at approximately $156.99. This is after hitting the high of $189.13 earlier in the week.
Solana Price Breaks Below Rising Wedge
The long lower wick of the candle indicates that the temporary defense level of the candle is at the $145 support area. Solana price has collapsed from the rising wedge pattern. This proves the completion of a higher-high pattern that was formed since the middle of 2024.
The chart shows that this trend began to develop once Solana had reached its bottom in the range of $80 at the end of 2024. Solana price then continued to climb towards $260 before the momentum ceased. The consolidation of prices in the wedge was further narrowed in September.
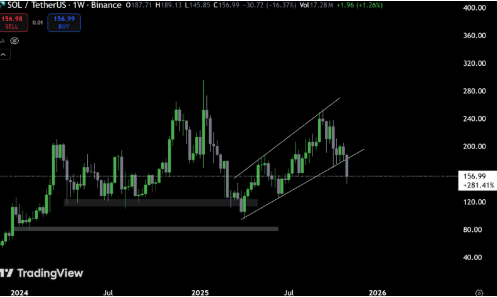
The form is in line with conventional technical behavior. Once the higher lows have been extended upon, the disintegration of the wedge intensifies the rate of profit-taking. This reveals the levels of horizontal support that had previously been horizontal.
The short-term objective after this exit is between $145 and $150. The zones are the mid-2024 accrual zones. Loss of this range may lead to further retreat to the areas of the $120-$110 level. This is where the historical buy volume is continuing.
The fact that volume readings are almost 17.28 million SOL also points to heavy distribution. This aligns with market players de-risking at critical resistance levels.
The layout of the candle is similar to other reversals in the past. These are similar to those in April 2024 and March 2025. The period saw a high decline, which was preceded by long rallies.
Solana Price Testing Historical Demand Zone
The daily chart reveals weakness in Solana’s short-term price structure. This decline began after the stock was rejected at $260 in late August. The chart data indicate that it has strong bearish momentum, characterized by a series of low highs.
The Solana price was around $146.97 as of press time. This point previously served as a breakout base in April. Momentum oscillators, as indicated in the lower indicators, are still in the negative territory.
The bars on the histograms continue to print below zero. This indicates the continued selling pressure. The RSI has fallen into the oversold area at 31.7.
This is the first time it has moved to the zone since early 2024. Traditionally, these circumstances have led to local rebounds, but there is no bullish crossover to avert skepticism.
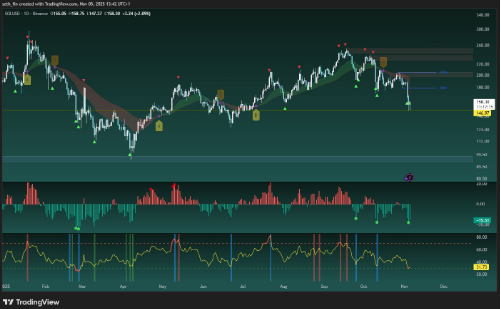
The two previous green triangle buy signals converge at the 150 155 range. This suggests that the market buyers might be trying to protect this range. Solana’s price has repeatedly failed to close above $170. This keeps the short-term bias tilted toward sellers in the coming sessions.
More analyst data also displays the structure of Solana overlayed on the key horizontal support and resistance levels. The price is already in the $160 demand range.
If buyers fail to break this area, the market may rebound toward resistance around $180–$190. This move aligns with a downward trendline that has limited upsurges since September.



