
 Bitcoin
 Ondo
Ondo NEAR Protocol
 Walrus
 Pearl
Pearl Pons
Pons Ethereum

The Pepe coin price is under pressure after breaking down, confirming a head and shoulders pattern. The meme coin has dropped more than 70% in the last year and is now down to near critical support levels. Some analysts are warning of further downside, and others point to a strong rebound if buyers step in again.
H&S Pattern Signals Bearish Continuation for PEPE Price
Ali noted that Pepe coin price has fallen beneath a crucial neckline, confirming the formation of a classic head-and-shoulders structure. His chart showed the left shoulder, head, and right shoulder pattern, and the neckline is broken near $0.0000065.
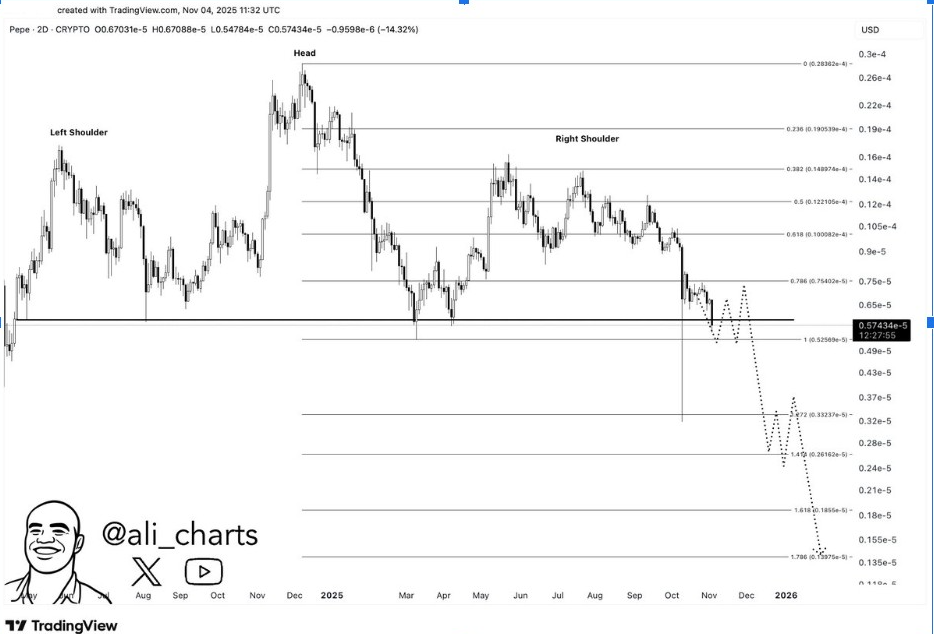
According to his projection, the PEPE price can drop significantly towards $0.00000185, which corresponds to the 1.618 Fibonacci extension level. Historically, this type of configuration can be considered as the continuation of a larger bearish trend, especially if confirmed by an increase in volume.
Today, it’s trading close to $0.0000057, down 14% in 24 hours. The breakdown indicated that sellers remain in control of the market, but a minor pullback towards retesting the neckline is not out of the question.
If that retest fails, the next supports would be near $0.0000049 and $0.0000037. Moreover, the lower Fibonacci zones could be used to define where the subsequent potential reversal may be.
PEPE Price Under Pressure Despite Trading Activity
According to the Pepe Community data, Pepe coin price is down 20% this week, marking its year-to-date loss at over 72%. Yet, despite the pullback, trading volume remains robust, hitting 24-hour volumes of $680 million, or approximately 29% of its circulating market cap.
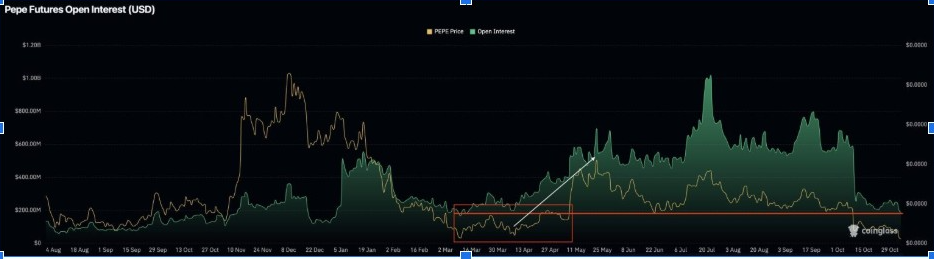
Interestingly, PEPE futures OI has plummeted to the lowest level since April, according to CoinGlass data. This drop is seen as traders taking off positions ahead of the next big move. The last time OI was this low, PEPE rebounded over 150% within days.
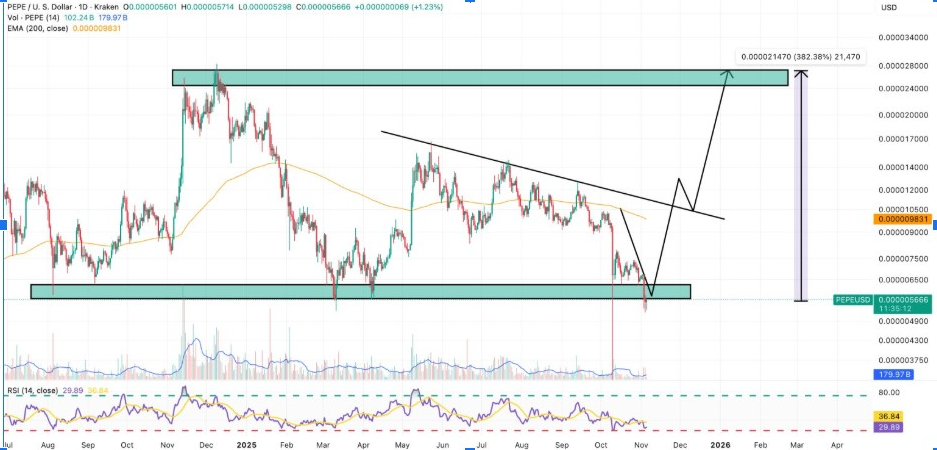
The day chart also showed the token reacting to a long-term support residing around $0.0000055, which is also the level that generated the April recovery rally. If sentiment changes, a bounce toward $0.0000090 or $0.000012 may be appropriate, which could fall within a potential 380% recovery toward $0.000025 in the months to come.
Memecoin Market Correlation Offers Broader Context
Chandler noted that PEPE’s current pullback parallels the overall downtrend in the meme coin sector. His comparative charts for PEPE, DOGE, FLOKI, BONK, and SHIB revealed synchronized declines, indicating that the correction isn’t specific to each token but rather a market-wide phenomenon.
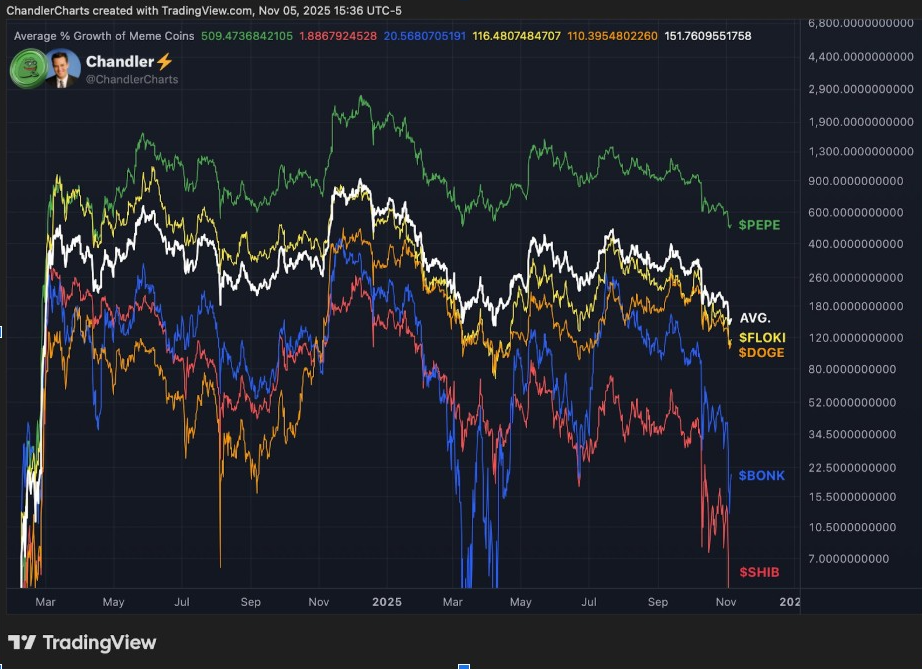
He added that PEPE is still one of the better performers among meme coins, with better average growth metrics over the course of the year. Chandler said as long as PEPE doesn’t break into deeper relative weakness, its structural strength could allow for a quicker rebound once sentiment is better.
This correlation suggests that PEPE’s weakness is likely to be short-lived as the meme coin segment stabilizes. Historically, coordinated recoveries throughout the sector have resulted in multi-week rallies, with PEPE typically leading given its liquidity depth and participation by traders.
Analysts Identify Key Reversal Zone If Support Holds
Analyst Waleed Ahmed indicated that Pepe coin price is consolidating around a long-term support horizontal zone. His analysis identified the critical level as $0.0000055, which is also the area where the April reversal began.
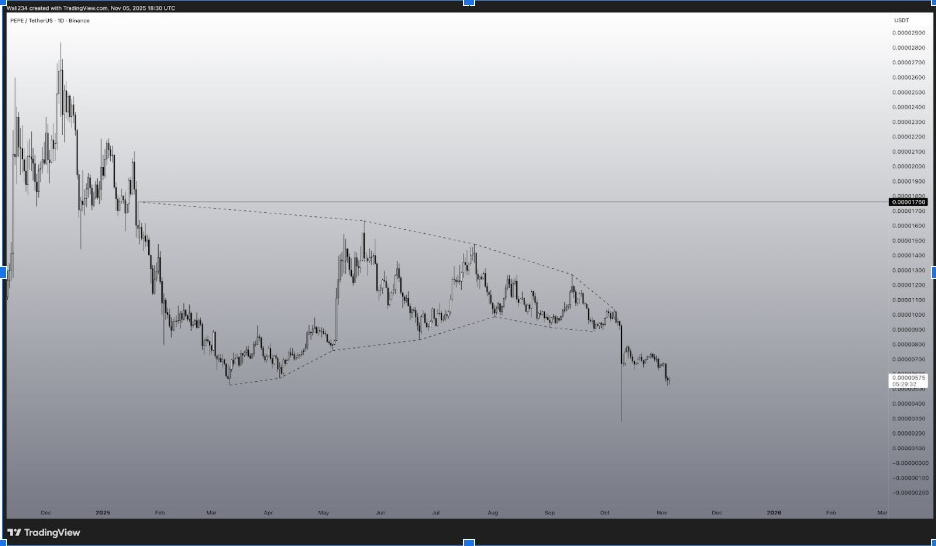
Ahmed’s chart exhibits a bearish channel formation, with a downward 200-day moving average serving as dynamic resistance. A breakout above this average will lead to further gains with targets near $0.0000176 and eventually $0.000021.
Sentiment remains bearish, but the RSI is trending downward into oversold territory, which could signal a potential relief bounce. With the selling pressure absorbed by the market and volume increasing, traders may observe the development of a trend reversal in the near future, before the end of the year.


