NEAR Protocol
 Bitcoin
 Puffer
 Hyperliquid
 ZKsync
 Pudgy Penguins
 Pearl
Pearl

Zcash price is nearing a major technical decision point after holding critical zones of demand. Market volatility has been increasing across various timeframes, resulting in high demand from trend traders. Analysts now define a number of breakout scenarios as ZEC heads into its most critical resistance areas this month.
Zcash Price Approaching Neckline of Key Reversal Pattern
Zcash price is now breaking into the neckline of a large Inverse Head and Shoulders structure. The neckline is priced between $680 and $700, and it remains the primary area of confirmation. Recent price action has swept the $540 liquidity area, which created the higher low needed for the right shoulder. The structure now looks cleaner than in previous stages of development.
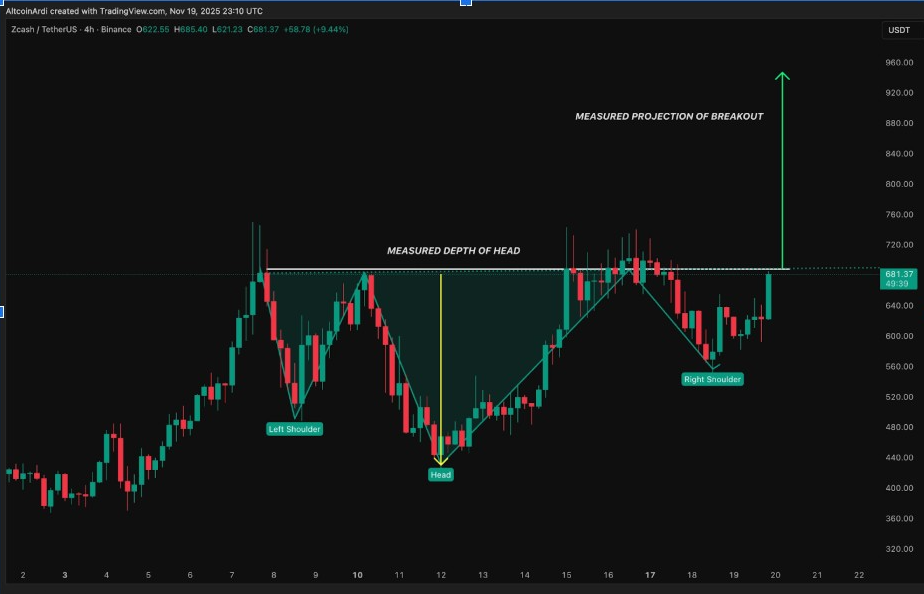
Ardi explained that the pattern only works when strong closes are above the neckline. He noted that acceptance at the top of this zone helps a measured target in the $800s. This projection takes the depth of the head as the breakout measurement.
The support levels remain $600, $580, and $540, while the resistance levels remain $680, $700, and $740. The pattern has also been in line with classical demand sweeps, which adds to the reliability of the formation.
Daily Trend Strengthens as Higher Lows Hold Firm
Jeremy pointed to a strong daily uptrend with clear higher lows since early October. The long-term ascending trendline is not broken and serves as the structural guiding force. ZEC defended this trendline twice, with both retests well marked with notable wicks and increasing volume. These reactions are a confirmation of sustained interest from mid-term buyers.
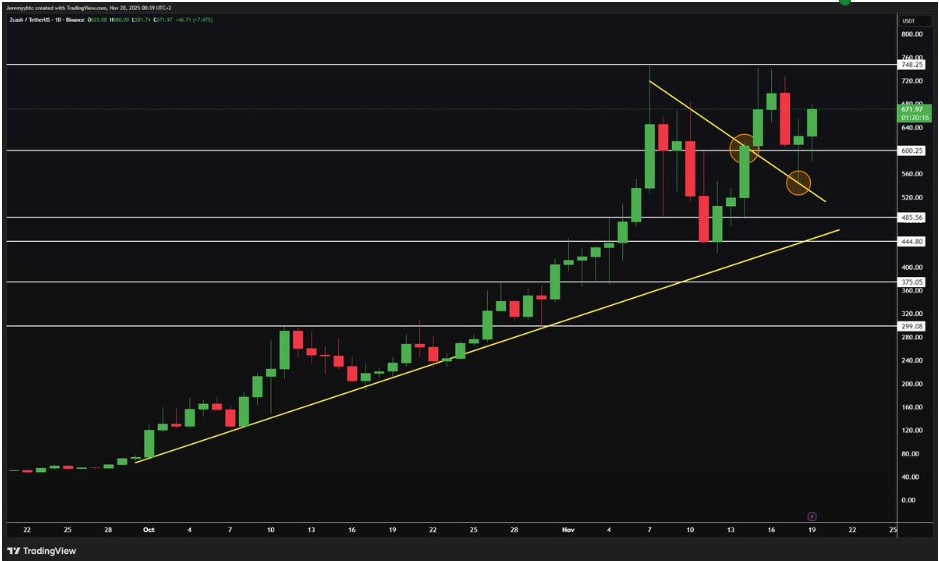
He also mentions repeated rejection of the descending resistance line. Price is now squeezed between trend support and horizontal resistance. This compression often precedes a breakout attempt, especially if candles are consistently trading above the 50-day EMA.
Notably, ZEC price currently trades at the mid-$600 range, which is the center of the recent consolidation range. Strength above $720 may confirm a new phase of expansion.
Wyckoff Distribution Pattern Forms Near Resistance Zone
Crypto Tony plotted a potential Wyckoff Distribution pattern on the 4-hour chart. The Buying Climax was formed at about $750, and the Automatic Reaction came at $580. Price then constructed multiple Upthrust tests around the same supply zone with controlled selling pressure. He now monitors an area of potential UTAD, which can cause a deviation in the wick.
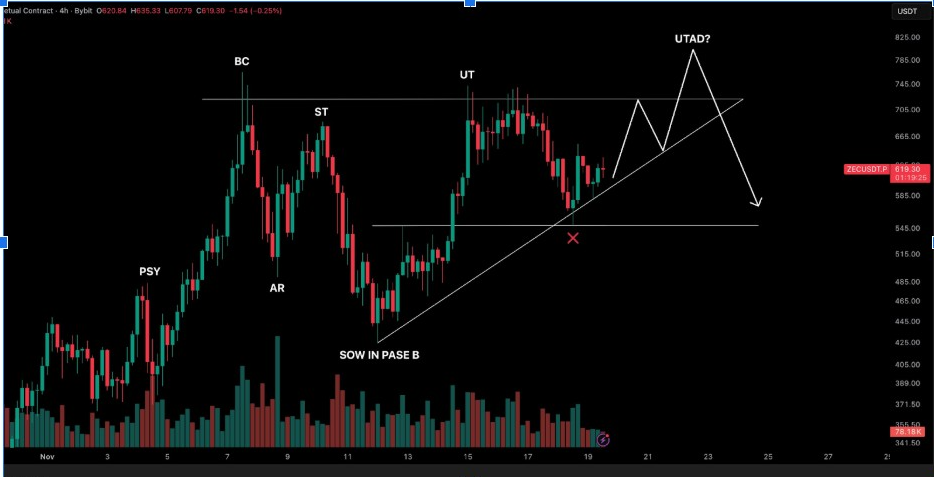
He puts a red “X” as the invalidation point for the current structure. A breakdown below this level is likely to confirm the weakness of Phase C. That scenario may provide a door for $545, which is in line with past support. However, a strong UTAD deviation could negate the setup into a bullish continuation. Such a deviation tends to absorb the remaining supply before trend extension.
Momentum Traders Watch Higher-Timeframe Reaction Levels
ElonTrades is instead analyzing ZEC’s overall momentum trend across all high-timeframe charts. His setup
showed price holding above the 200-day EMA, which is still a major strength signal. ZEC price has also maintained buying pressure near the $600 region during Bitcoin weakness. That divergence helps make the case for relative outperformance.
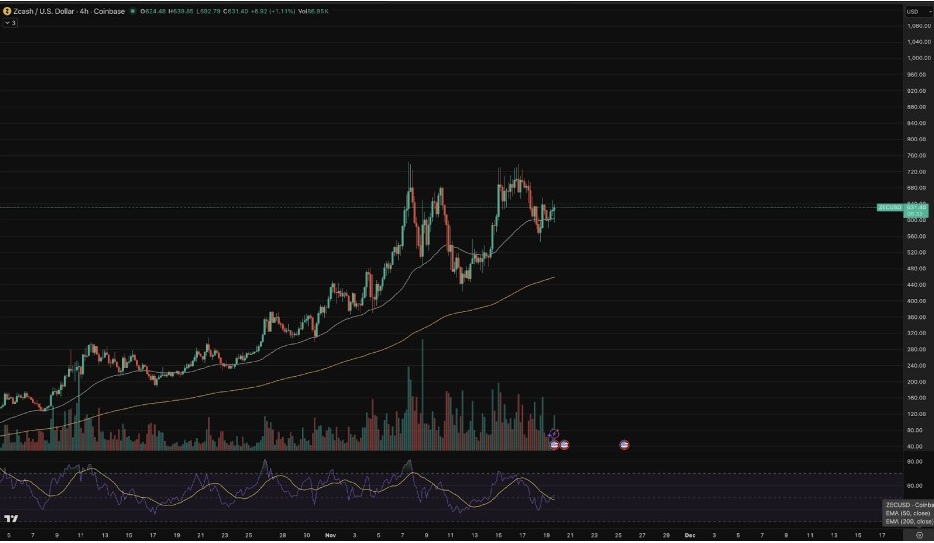
He added that RSI is still in neutral territory and there is room for more upside strength. Volume has also been relatively consistent, which confirms continuity of participation. Price is attempting to regain the $650-$670 zone, a crucial reaction band preceding the neckline. He believed strong candles above this area may invite a retest of $720. This retest would then give ZEC another attempt at breaking out of the neckline.