
 Doge Pepe
 Zylo Ecosystem
 Pearl
Pearl Optimism
 Bitway
 NEAR Protocol
 Pons
Pons

The XRP price is heading towards one of important support levels in years, as its moves squeeze against the $1.8-$2.0 demand zone. Analysts confirm that there is a bearish two-top weekly.
XRP crypto is currently facing historic support dating back to 2017. The support previously led to significant turnarounds in 2018, 2020, and 2024.
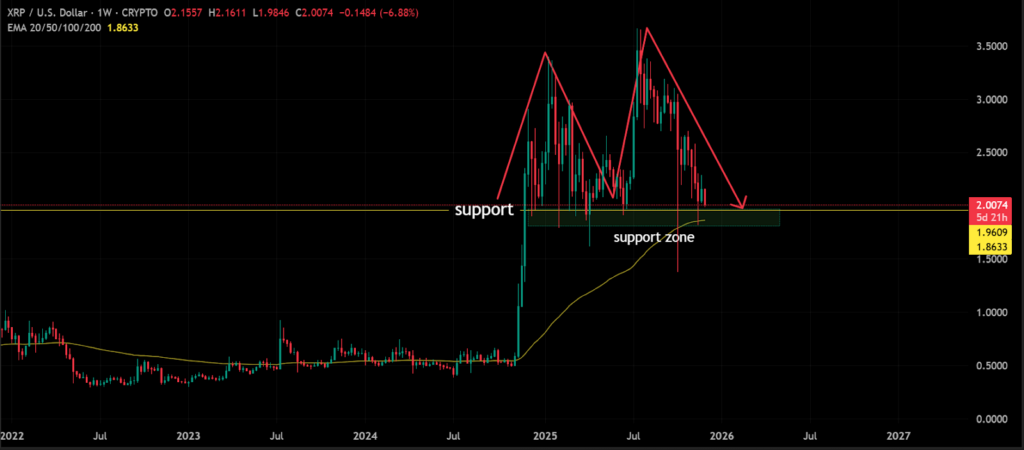
The zone is coincidental with the weekly 100-EMA, which now stands close to the $1.86 level. There is a clear pattern of lower highs in the period since the middle of 2024.
The price action forms an extensive double-top structure, centered around $3.30. The two peaks were made at a similar price range, which gives the pattern more credibility. The neckline intersects the area between the $1.80 and the $2.00 area.
Analysts note that a weekly close below $1.80 would constitute a breach of the multi-year floor and would signal a double top. The move would change the long-term bias to downwards continuation. The price is still above the threshold, though repeated pressure has squeezed it directly into this decision zone.
Volume patterns across the weekly structure suggest prolonged accumulation in the same zone now being retested. The 2024 rally began from within this demand block, breaking through resistance zones that had capped XRP since 2022.
The price is now retesting that same structure, marking the first return since the 2024 breakout.
Long-term XRP Price Patterns Back Breakout Scenario
More data from analyst EgragCrypto shows that XRP price is trading inside a long-term ascending triangle. The trendline has been rising since 2018, while the horizontal resistance overhead remains defined by the 2017 wick peak.
This multi-year consolidation shows candles tightening into the apex. This indicates reduced volatility as the price compresses between the rising support and overhead resistance.
The 12-month chart marks $0.75 as the broader structural floor, well below current levels. It, however, highlights the resistance area near $3.30 as the upper boundary of the formation.
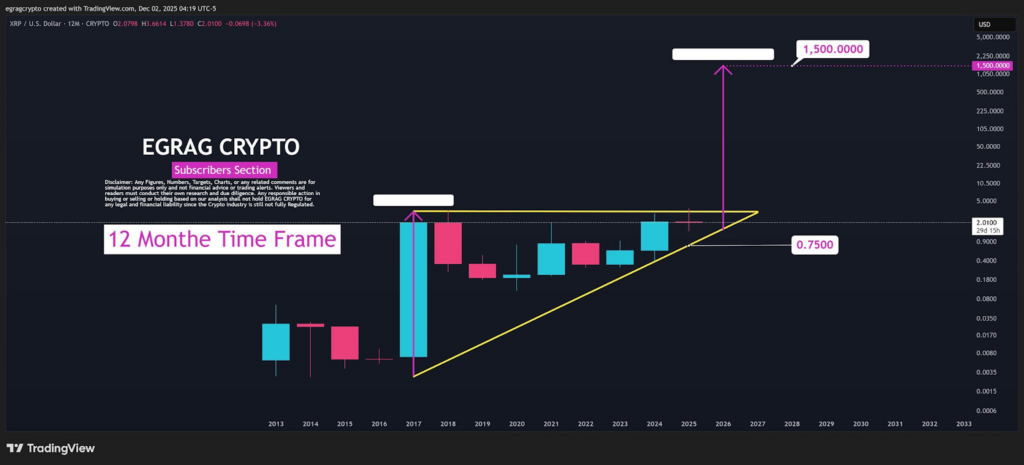
Egrag’s analysis suggests an “explosive move” may occur when XRP completes this tightening phase. While the chart highlights a hypothetical upside extension, the current focus remains on the compression itself and the historical behavior of yearly consolidation structures.
This angle complements the weekly analysis by showing how XRP’s current decline fits into a larger, multi-year framework rather than an isolated event.
XRP Price Breakout Could Face Resistance
The 4-hour chart indicates that the next major selling wall is located around $2.25. Previous intraday rejection zones formed here throughout November. The zone has acted as a barrier during repeated tests, each turning price back into the local demand block near $2.00.
When XRP jumps over the wall of $2.25, the chart displays a clear gap in the past resistance all the way to the $2.60 level. This supply unavailability suggests that there may be a possible acceleration at the two levels once momentum has been established.
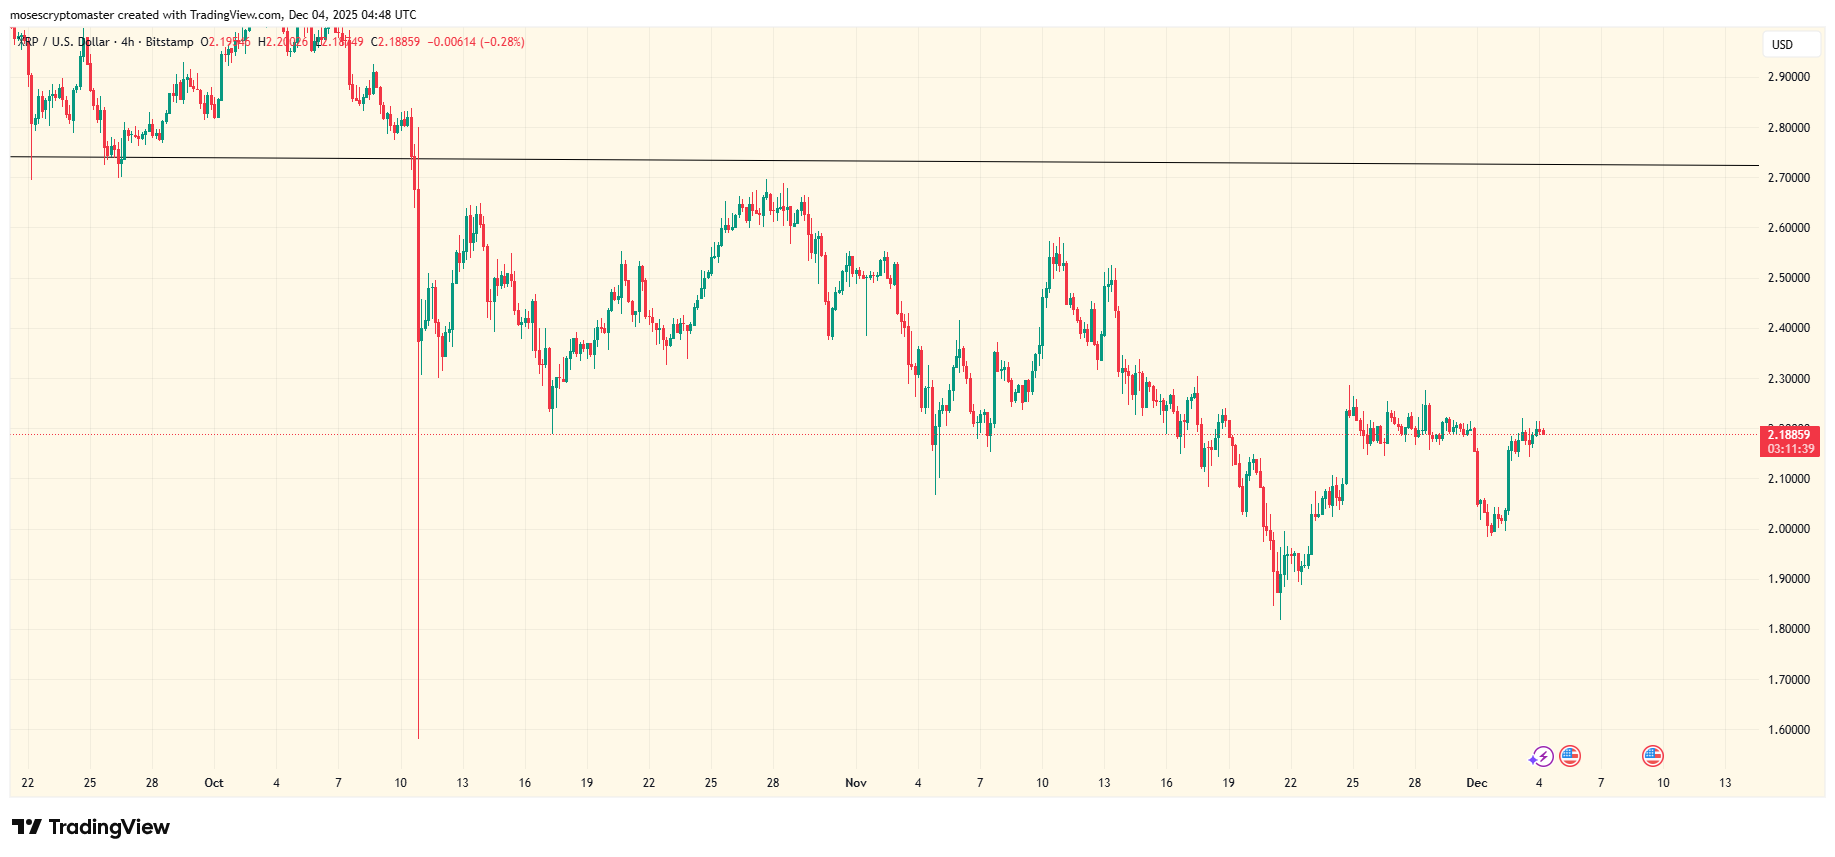
The strongest support is between $1.95 and $2.05. It shows that there has been consolidation, with several high-volume defense points.
In conjunction with the technical signals, demand for ETFs is increasing. According to recent data, ETF clients made new purchases of $89.65 million, bringing the total XRP held by ETFs to $723.05 million. This inflow is preceded by a wider rise in activity in digital-asset investment products during the quarter.
This nearly $90 million of new capital is an addition at a time when XRP is trying to find a multi-year bottom. This indicates that institutions are still allocating to it despite recent price swelling.




