
 Doge Pepe
 Bitway
 Optimism
 Pearl
Pearl Pons
Pons Quantus
 Starknet

Chainlink price pulled back for the second consecutive day. This mirrors the performance of the broader crypto market.
LINK price dropped to $13.68, down from this week’s high of $14.98. So, will the price of Chainlink rebound as ETF inflows resume after a two-day pause?
LINK ETF Inflows Resumed After a Two-Day Pause
Chainlink price remained under pressure today, Dec. 11, as the broader crypto market crash accelerated.
ETF inflows rebounded after a two‑day pause, showing stronger demand for the LINK token. This renewed interest could help support the LINK price.
SoSoValue data shows the new Grayscale Chainlink ETF (GLNK) attracted over $2.56 million in inflows on Wednesday. Those inflows pushed its cumulative total to $50.8 million.
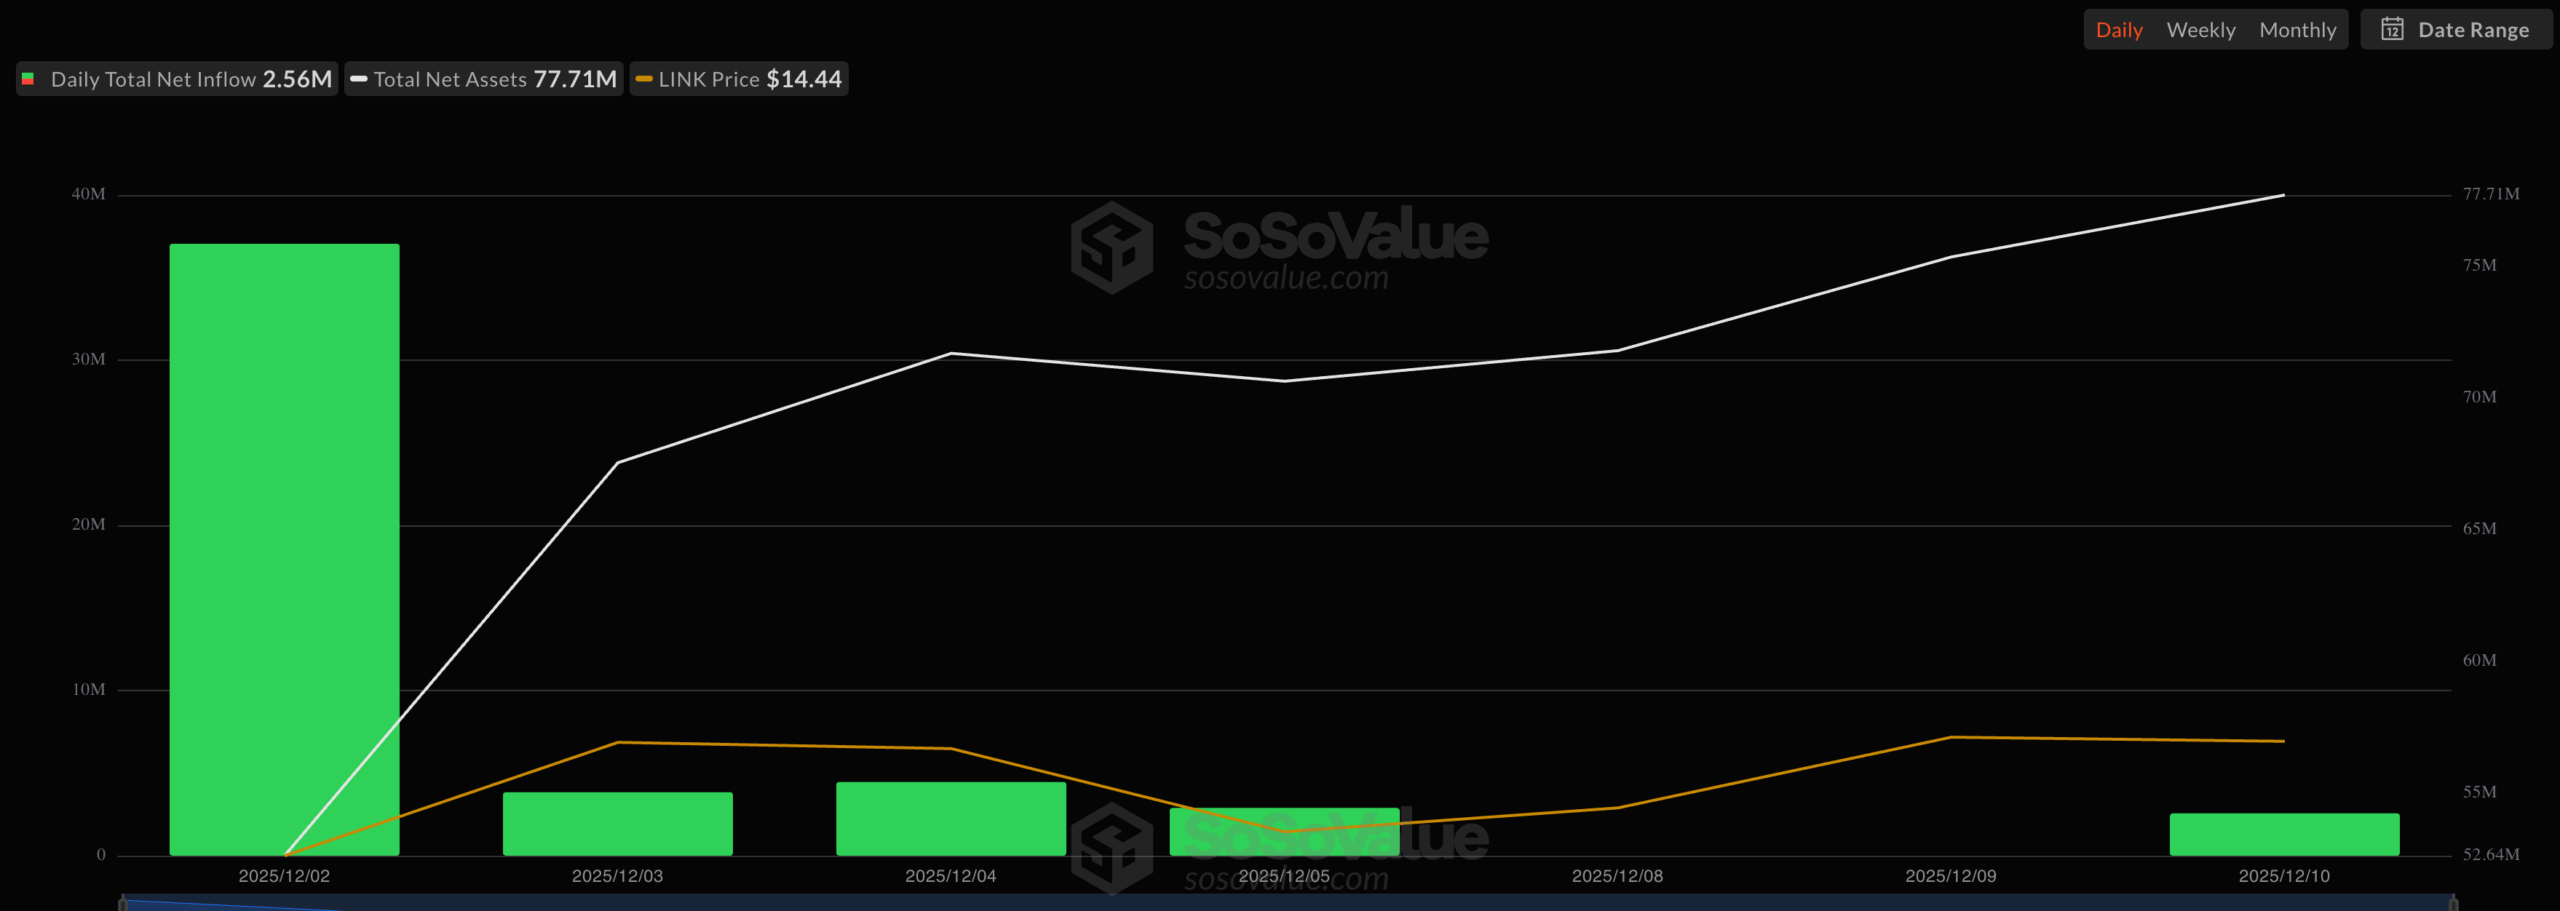
These inflows have increased the total net assets in this ETF to over $77 million. This surpassed those of other older funds.
For example, the Canary Litecoin ETF, which was launched in October, has $7.8 million in net assets. Similarly, the Canary HBAR ETF has $65 million, while the two Dogecoin funds have just $6 million in assets.
On-Chain Metrics Point to Resilient Demand
Meanwhile, on-chain data points to a gradual Chainlink demand from retail investors and whales.
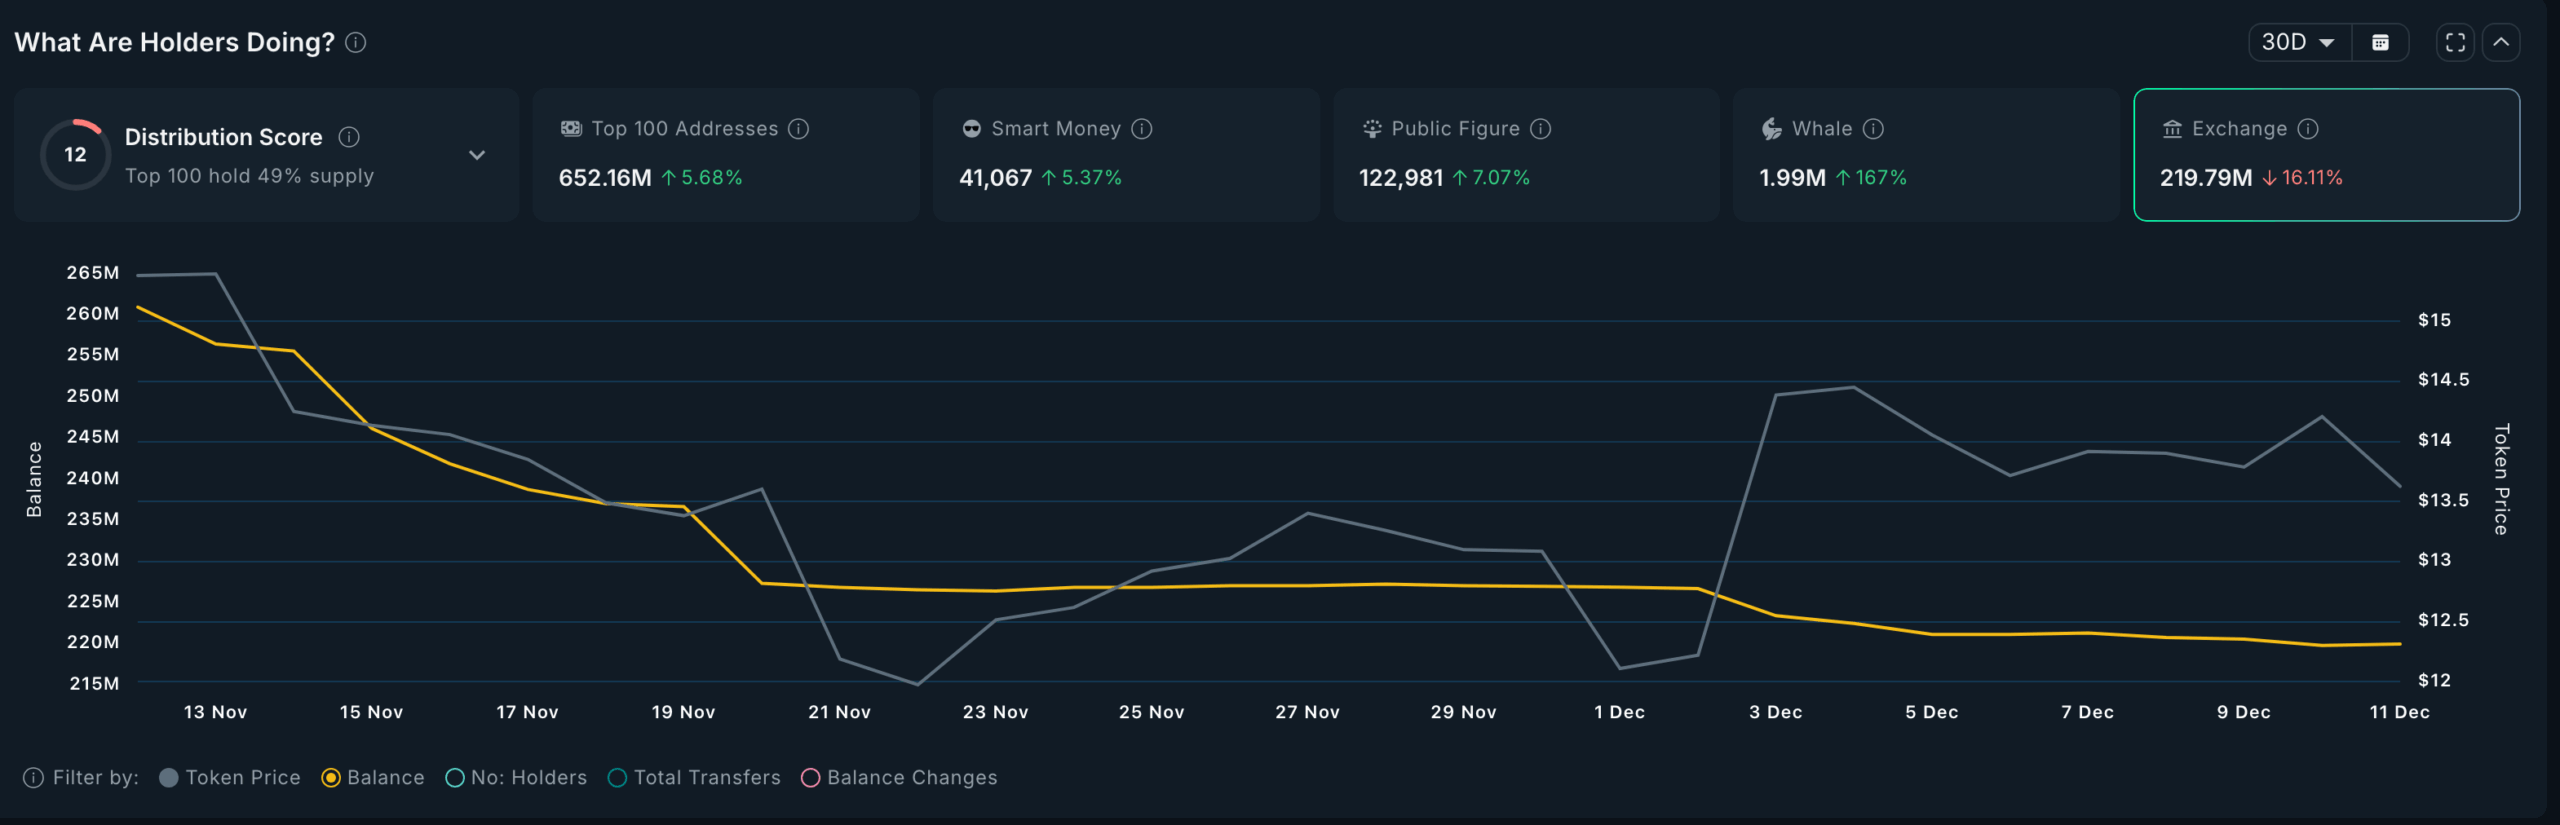
Data compiled by Nansen shows that whale accumulation rose by 167% in the last 30 days. It moved from 744,035 to the current 2 million LINK tokens.
Rising whale demand often acts as a strong bullish catalyst in fundamental analysis. These large investors typically have more experience than retail traders.
As such, the fact that these investors are buying is a sign that they expect the price to bounce back over time.
Smart money investors, who have the expertise of executing profitable trades, have boosted their holdings by 5.6% in the last 30 days. At the same time, the top 100 addresses increased their positions by 5.6% to 652.1 million.
All this growth has led to increased exchange outflows. It’s a sign that investors have been pulling out LINK tokens from exchanges, possibly to their self-custody wallets.
The supply of LINK tokens in exchanges has dropped to 219.7 million, a 16% decline from the previous month’s 260 million. This supply decline has been accelerating in the past few months as the coin’s demand has jumped.
Additionally, the Strategic LINK Reserves has boosted its holdings to 1 million in less than four months. This growth will likely keep rising as more companies embrace Chainlink’s solutions.
TMX, the biggest stock exchange in Canada, offers a clear example. It selected Chainlink to provide oracles as it moves its vast data on‑chain. This means that developers can easily incorporate this data into their applications.
Other companies and organizations are also putting their data on-chain using Chainlink. The most notable one is the US government, which now publishes its data to the network.
Chainlink Price Technical Analysis Signals Potential Rebound
The daily timeframe chart shows that the LINK price bounced back from a low of $11.88. There, it formed a double-bottom pattern.
Its rebound found substantial rejection at the 50-day Exponential Moving Average (EMA). It also struggled flipping the Supertrend indicator from red to green.
Still, on the positive side, there are signs that the token has more upside. For example, it has now formed a small bullish flag pattern, which is made up of a vertical line and a rectangular channel.
Most importantly, the token has been forming a falling wedge pattern in the past few months, and the two lines have converged.
Also, the Relative Strength Index (RSI) has bounced back and moved slightly above the neutral level of 50.
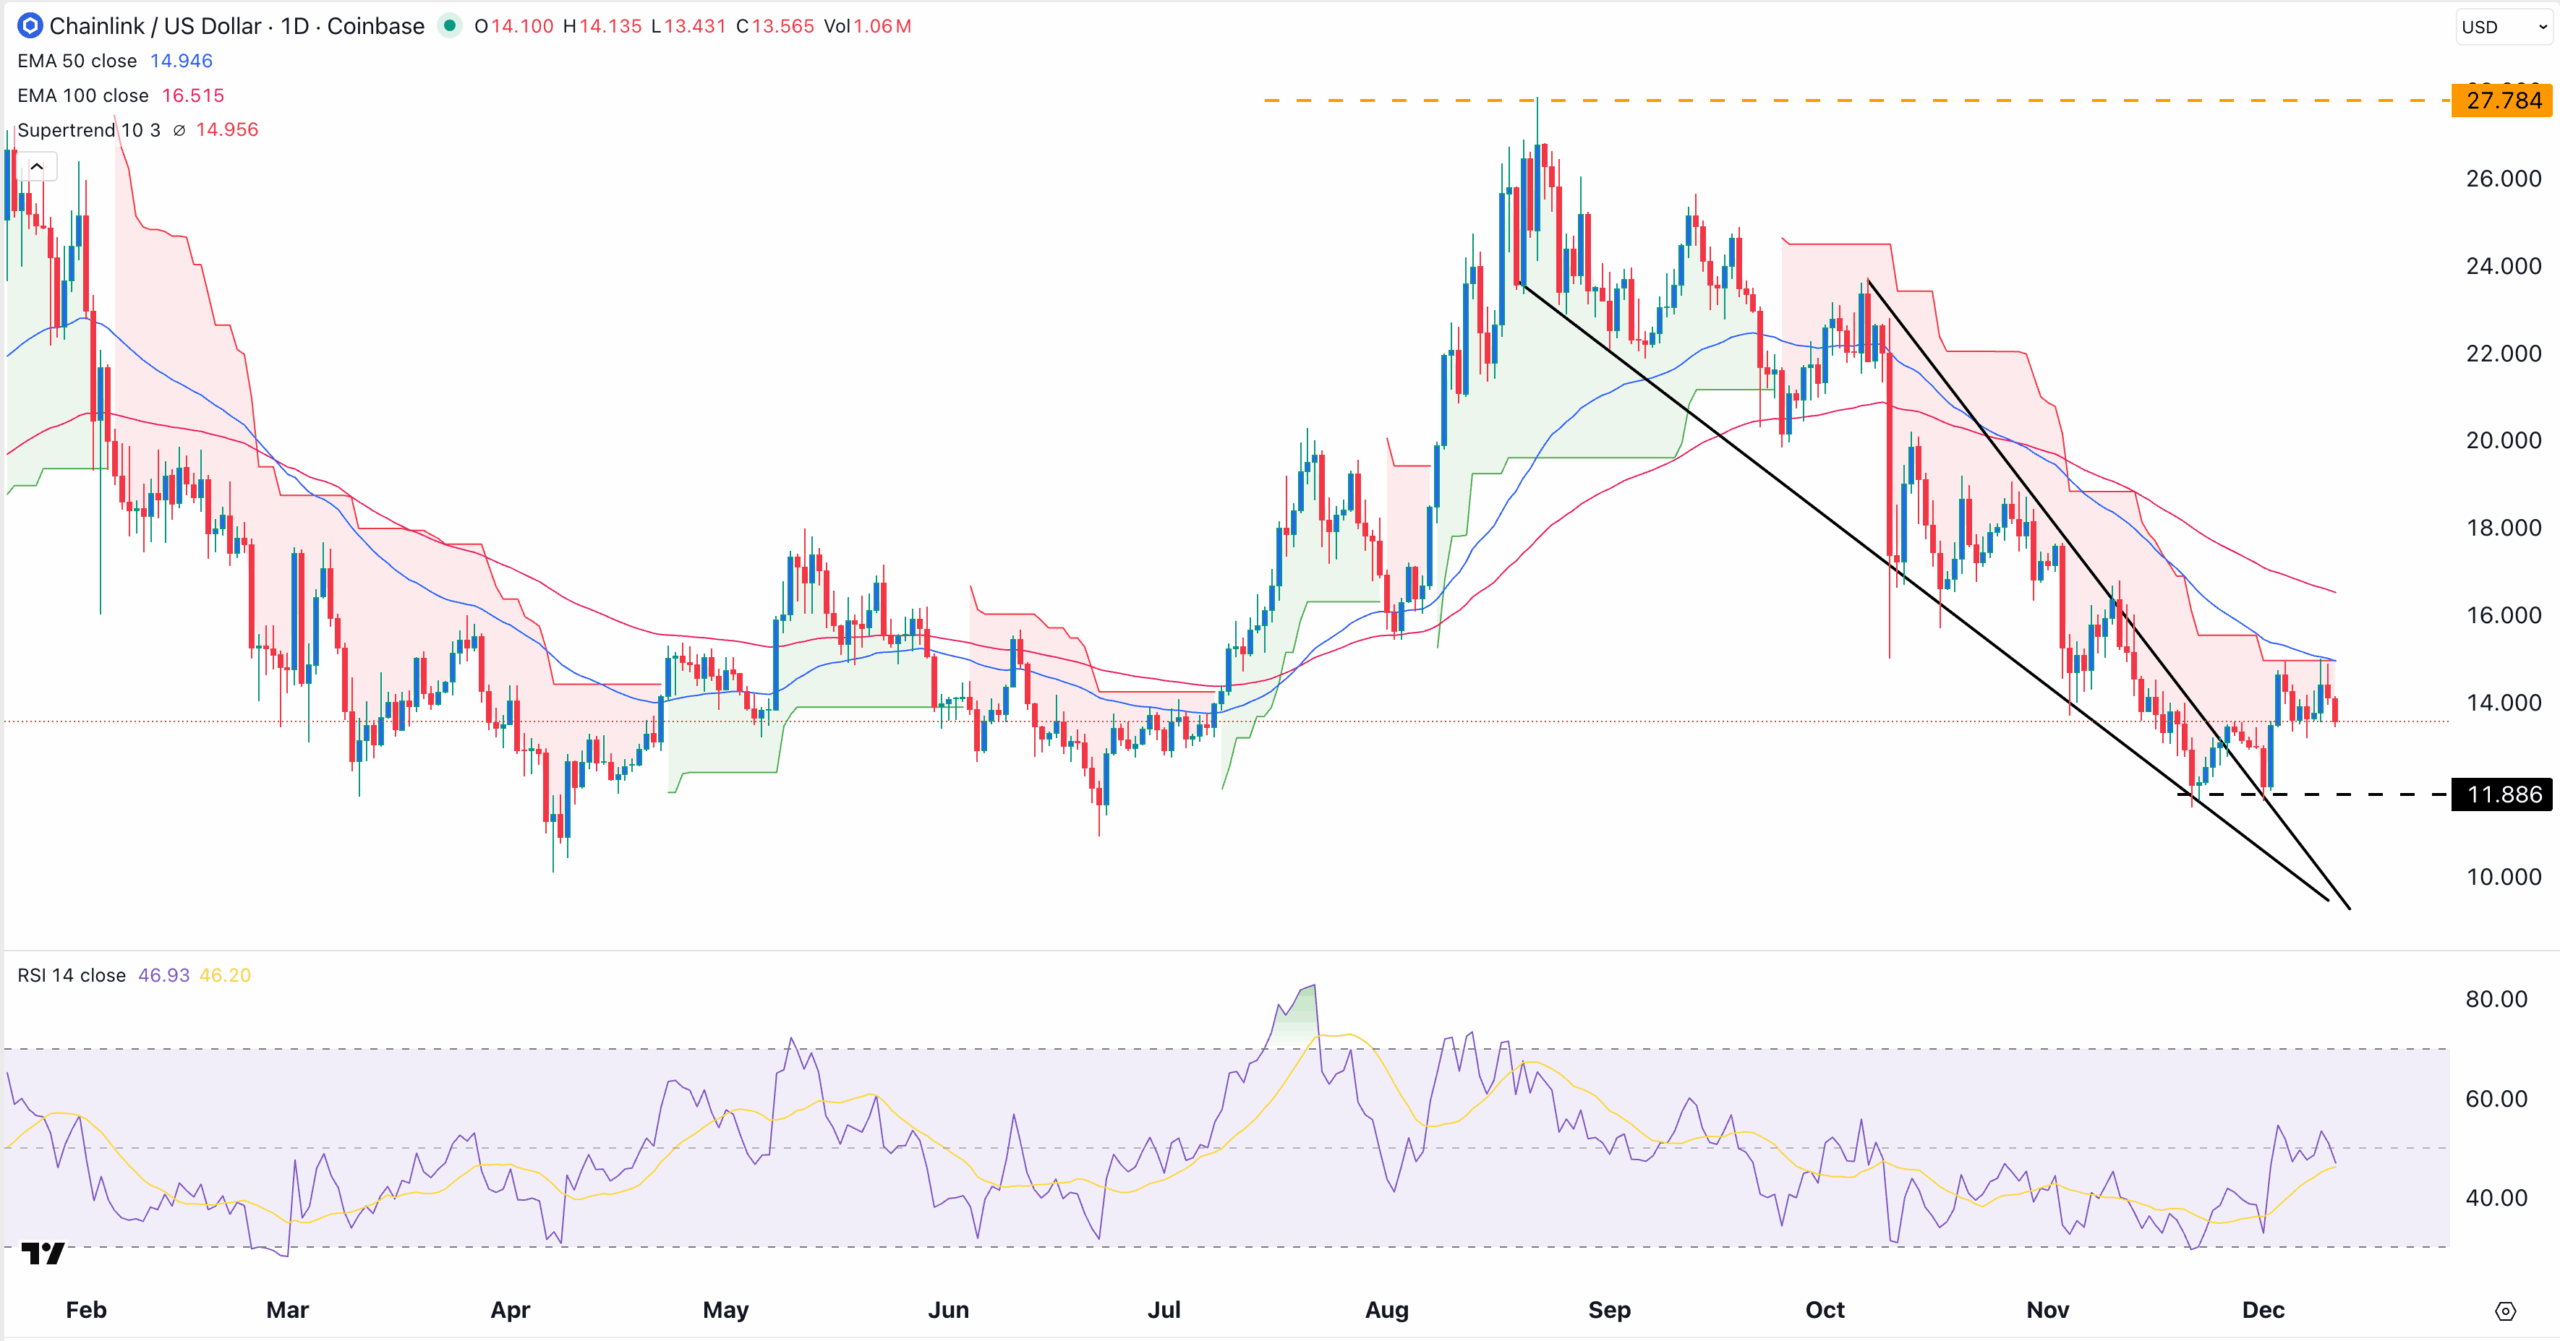
Therefore, the most likely scenario is where the token continues rising as bullish investors target the psychological level of $20. A move above this resistance will point to more gains, potentially to the psychological year-to-date high of $27.78




