Wisp
Wisp Doge Pepe
 Crawlerpad
 Zylo Ecosystem
 Pearl
Pearl Basic Attention
 Quantus

XRP price prediction coverage is shifting back toward structure after the monthly RSI rebounded from the 50 zone. At the same time, analysts noted XRP price spent about 393 days consolidating.
This mirrors the pre-2017 setup. A separate fractal roadmap also mapped Fibonacci extension zones and listed a $27 target band.
XRP Price Prediction: Monthly RSI Bounced From the 50 Zone
EGRAG CRYPTO noted XRP’s monthly RSI dropped into the 50 zone. He described the bounce as a reset phase common in base-building.
The post framed the move as a point where momentum cools, weaker holders exit, and a foundation forms. As the XRP price works through this stage, the RSI trend guides whether the recovery remains intact.
The same RSI view laid out a probability split tied to how the XRP price behaves around key monthly closes. XRP price prediction puts a 60% chance on a slow trend rebuild. At the same time, it assigned 30% to more sideways action first.
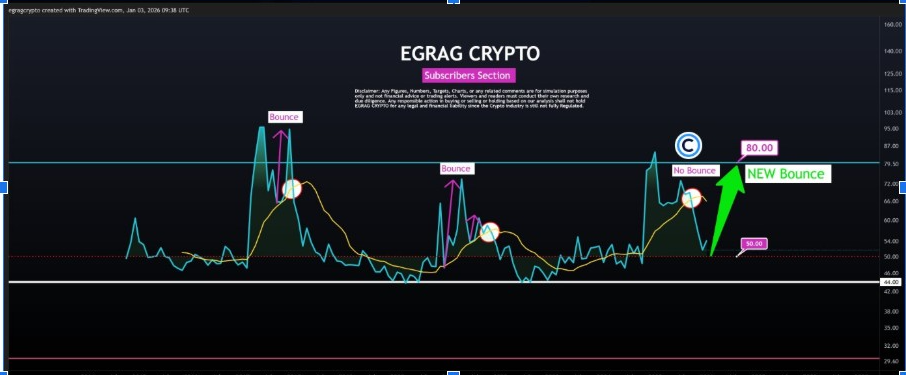
More so, the RSI analysis kept a 10% breakdown path on the table. However, it linked that outcome to macro support failing.
The RSI framework does not point to a parabolic move yet. It suggests stronger momentum only if RSI climbs toward the 70–80 zone. Until then, the XRP price prediction stays in a structure-recovery setup. It has not reached a confirmed cycle peak.
XRP Price Ends 393-day Consolidation
Analyst Steph_iscrypto flagged that XRP price completed roughly 393 days of sideways accumulation. This matches the duration seen before the 2017 breakout.
The chart shared showed compression inside a downward-sloping channel near the end of the range. In the older cycle, XRP price broke out of that channel and accelerated soon after.
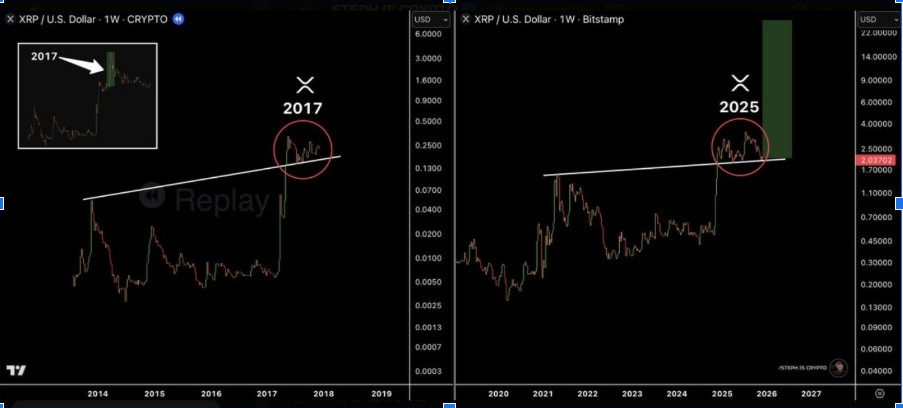
In the current setup, the chart again suggested an early breakout trend. On the other hand, the post noted market attention still looks muted. If XRP price continues to post higher lows while pressing the channel’s upper boundary, the structure remains constructive.
XRP Price Prediction: Extension Zones Signal $8–$27 Range Amid Market Momentum
ChartNerdTA said XRP hit the 1.272 Fibonacci extension in a prior cycle. He added it also reached the 1.618 extension. The earlier expansion unfolded without regulatory clarity. It lacked the macro tailwinds seen in the past year.
Based on that template, it presented this cycle’s extension zones as a range that runs from about $8 up toward $27.
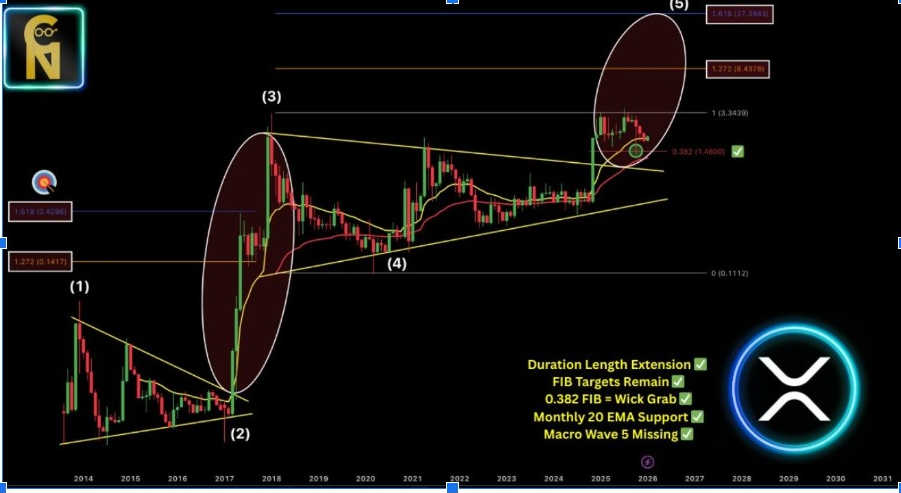
The fractal chart also referenced technical markers that traders often use to judge trend health over longer horizons. It cited a 0.382 Fibonacci wick grab, and it noted the monthly 20 EMA as a support area worth tracking.
Fibonacci extensions are projections, so analysts treat them as zones rather than exact targets. As a result, XRP price prediction discussions often pair those levels with structural signals like RSI trend and breakout confirmation.
If momentum builds and the market accepts higher prices, the $8 to $27 map stays relevant. Meanwhile, XRP overtook BNB to rank as the third-largest crypto by market value.
The move followed a breakout from an eight-month downtrend. ETF inflows near $14 million added support. Also, the traders are watching whether the rally can extend toward $2.50.
At the time of writing, XRP price traded near $2.00 after gaining 8% in the last 7 days. Its market capitalization stood around $121.5 billion. Trading volume over the past 24 hours was about $3.06 billion.