
 Pearl
Pearl Bitway
 NEAR Protocol
 Sui
Sui Pudgy Penguins
 Starknet
 Pons
Pons

Polygon price has rebounded in the past few days, mirroring the performance of other tokens. It bounced back from a low of $0.0995 on January 1 to the current $0.1270. So, will the POL price rally continue as the burn rate and stablecoin growth gain steam?
Polygon Price Rises as Burn Rate Gains Steam
Polygon price has done well in the past few days, moving from a low of $0.0995 to the current $0.1270. This rebound was driven by the ongoing crypto market rally, which has accelerated in the past few days.
Polygon shows strong fundamentals in the crypto industry. The ongoing growth of Polymarket, a popular prediction market, drives it.
Data compiled by Nansen shows that the network growth accelerated in the last 30 days. Its transactions rose by 19% in this period to 178 million. This made it the third-fastest growing chain after Monad and Aptos.
More data shows that the number of active addresses rose by 28% in the last 30 days to 15.9 million, much higher than other layer-2 networks like Arbitrum and Optimism.
Most importantly, the growing transactions helped to push its fees much higher. Fees rose by 80% in this period to $1.63 million, making it one of the most profitable layer-2 chains in the crypto industry.

The soaring fees helped to contribute to the POL token burn. Data shows that the network has already burned 8.2 million POL tokens this year alone. In contrast, the network burned 11.8 million tokens in the whole of last year.
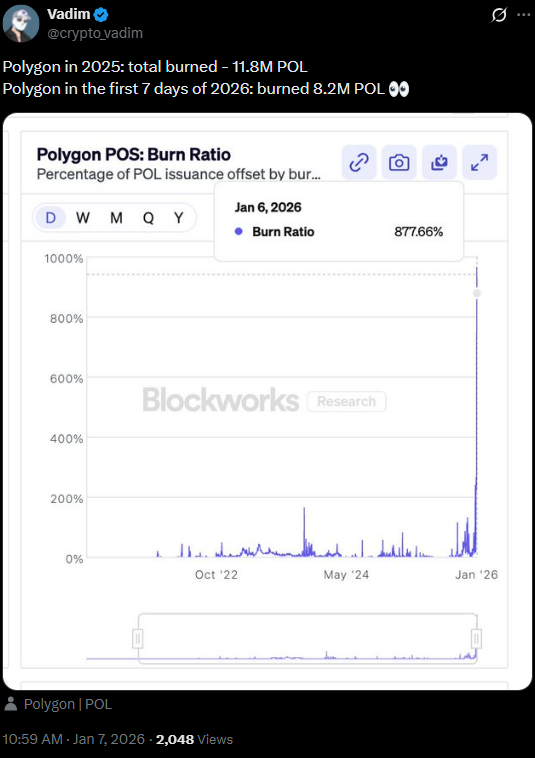
A token burn is a situation where a crypto project removes tokens from circulation. It helps reduce its inflation rate. In theory, the token burn should boost a token’s price. However, a correlation between burns and prices has not been established.
Polygon Payments and Stablecoin Growth are Accelerating
Polygon network has become highly popular in the payment industry. This has made it reach deals with some biggest companies in the fintech industry, like Revolut, Paxos, Mastercard, and Shift4 Payments. Its Revolut transactions have soared, reaching over $856 million in 2025.
Data compiled by Artemis shows that Polygon’s adjusted transaction volume has continued rising in the past few months.
It handled transactions worth over $28.2B in the last 30 days as the number of transactions soared to over 254.2M. Most of its transactions are in the gaming industry, followed by centralized and decentralized exchanges and payments.
The stablecoin supply in Polygon has jumped to $3 billion. It’s a trend that will continue after the signing of the GENIUS Act into law last year.
Polygon Price Technical Analysis Suggests a Rebound is Possible
The daily timeframe chart shows that the Polugon price bottomed at $0.0995 on January 1. Then, it started bouncing back. It has rebounded by nearly 30% from its lowest level this week.
Most importantly, the rebound happened after the token formed a large falling wedge pattern. It is made up of two descending and converging trendlines. This rebound happened as the two lines neared their confluence.
Polygon price has moved above the 50-day EMA, while the Average Directional Index (ADX) remains above 40. Other oscillators like the Relative Strength Index (RSI) and the Percentage Price Oscillator (PPO) have pointed upwards.
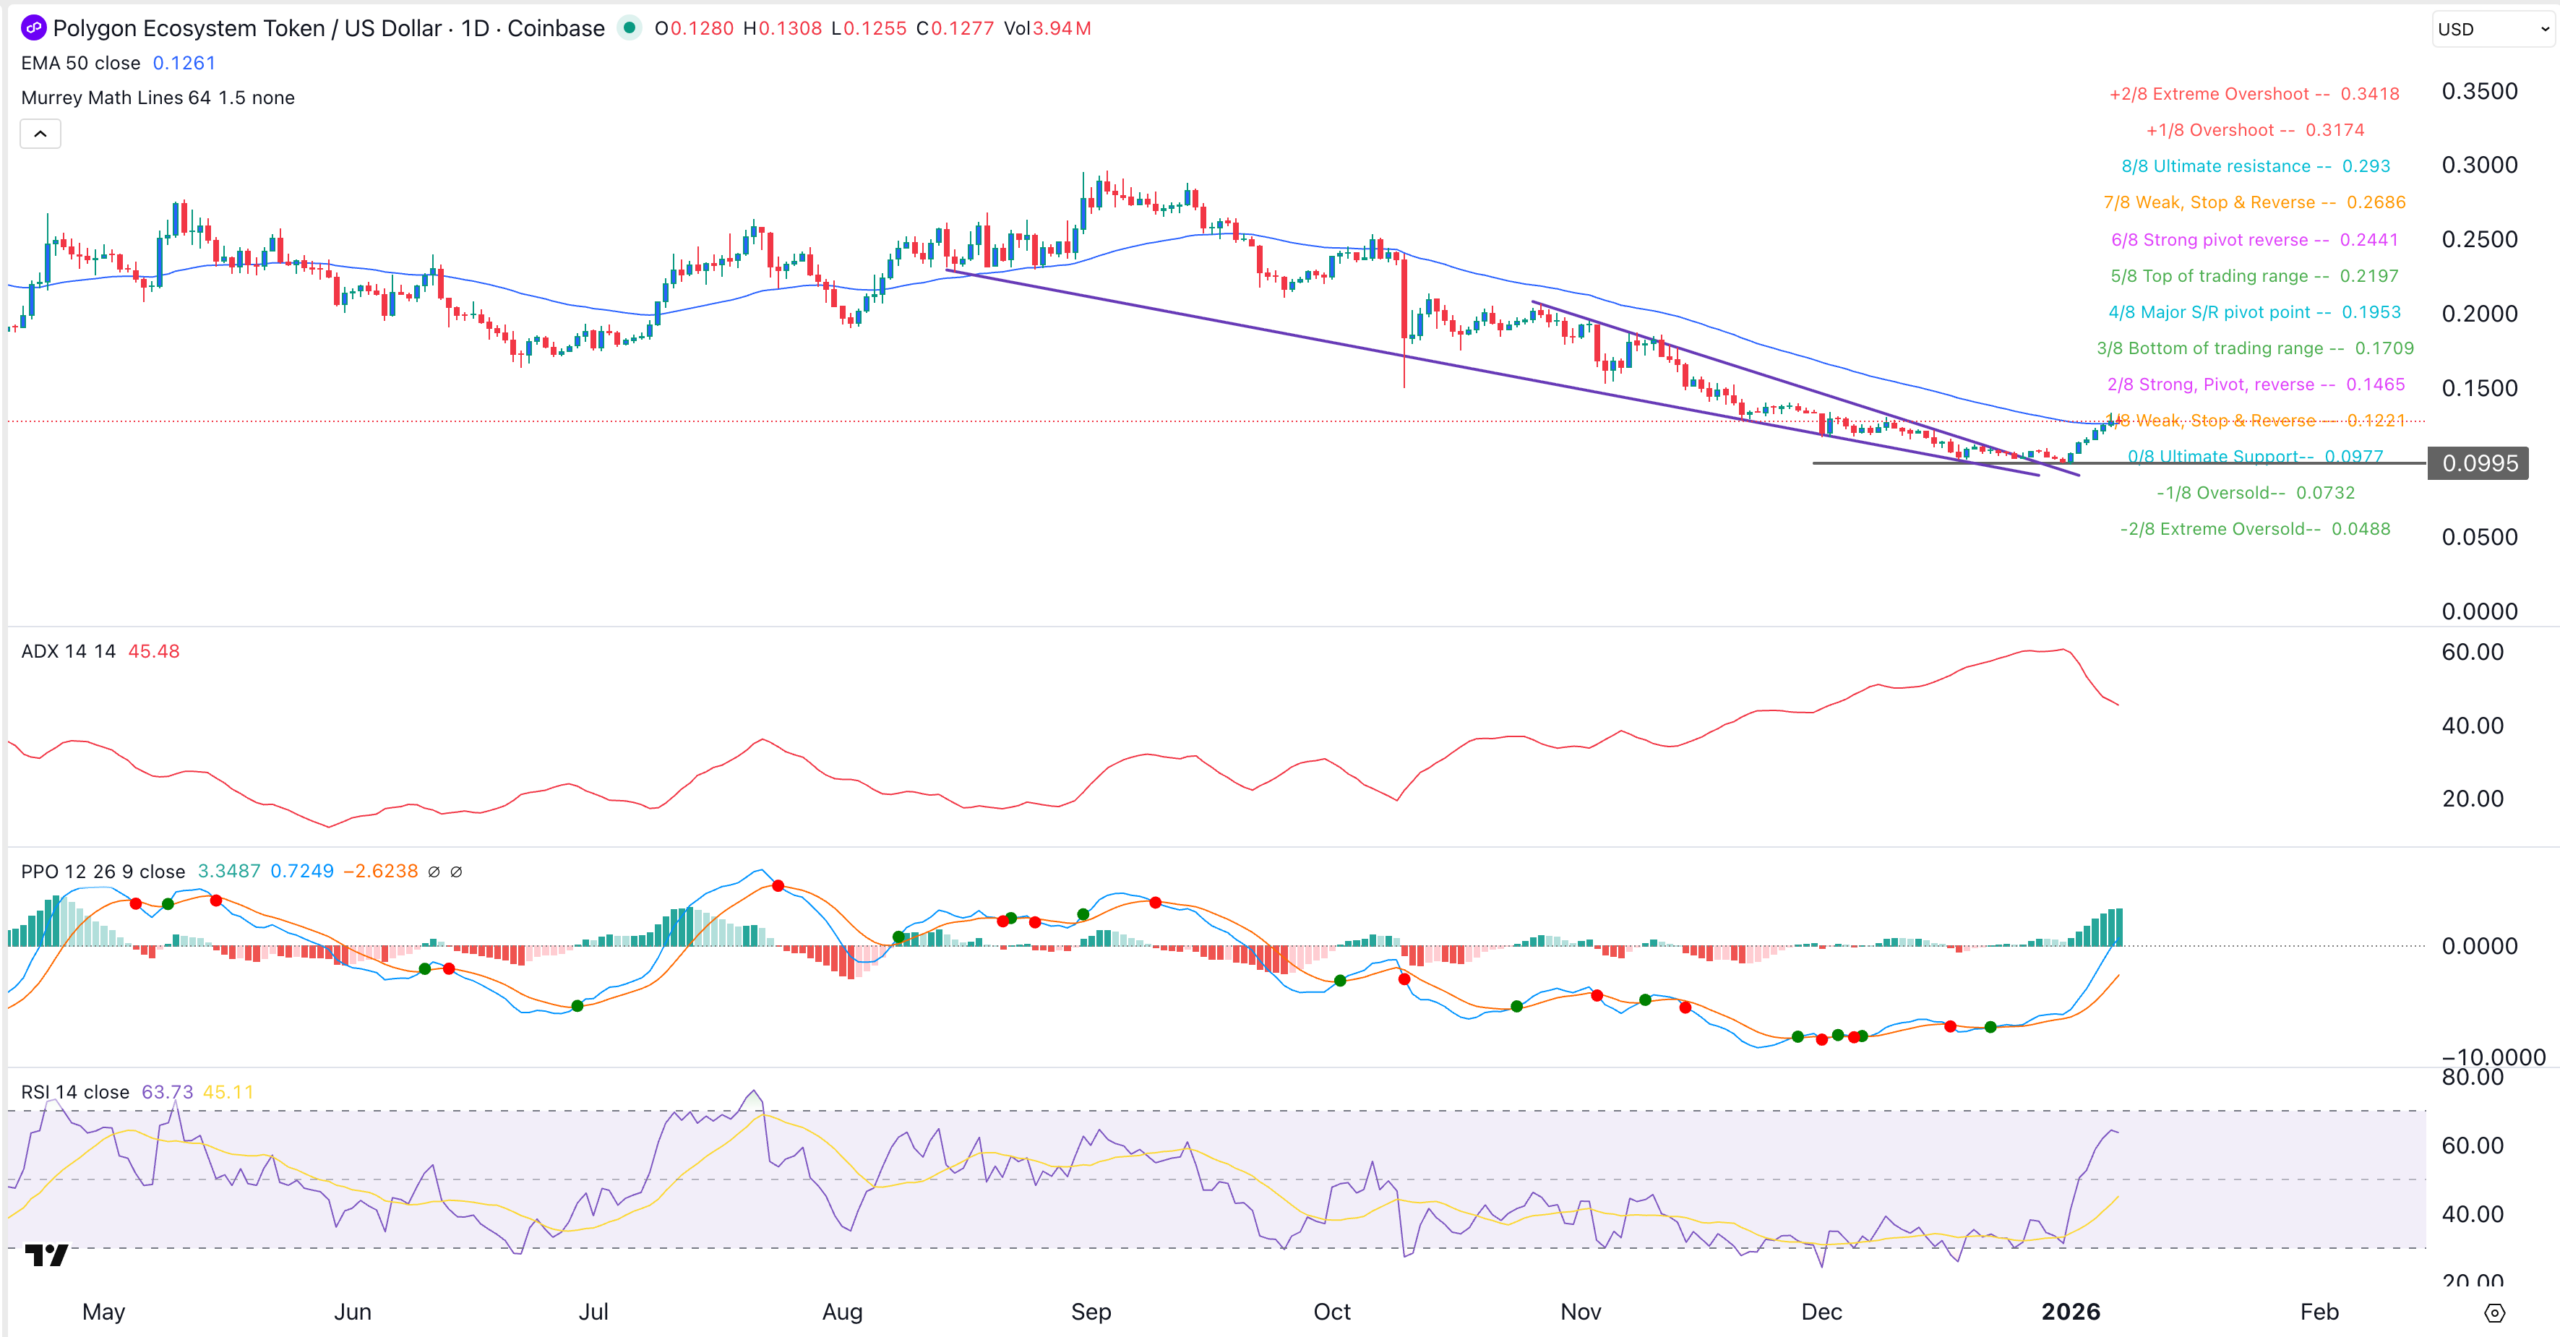
The most likely scenario shows Polygon price continuing to rise. Bulls target the Major S/R pivot at $0.1953. This level stands about 58% above the current price.
The alternative scenario is where the token retreats and retests the year-to-date low of $0.995. Such a move will be bullish as it will be a sign that it has formed a double-bottom pattern, a common reversal sign.




