
 Pearl
Pearl Zylo Ecosystem
 Bitway
 Derive
 Walrus
 Quantus
 Pudgy Penguins

Bitcoin’s price has finally slipped back under $90,000 amid strong selling pressure. With the US-EU trade war uncertainties and macro shift, risk-on assets are under stress. BTC is now approaching critical support at $87,000, forming a bearish flag pattern. If the bulls fail to defend this, we could be heading for further downside.
Bitcoin Price to Test A Crucial Bear-Flag Support Ahead
Popular analyst Crypto Patel noted that the Bitcoin price is approaching a technical inflection point. He said that $87,000 will serve as the key support on the downside for a potential bear-flag structure.
As per Patel, a clean breakdown below $87,000, followed by a failure to reclaim that level, could trigger a broader downside expansion. The analyst also provided downside targets for Bitcoin at $80,000, $72,000, and potentially $60,000.
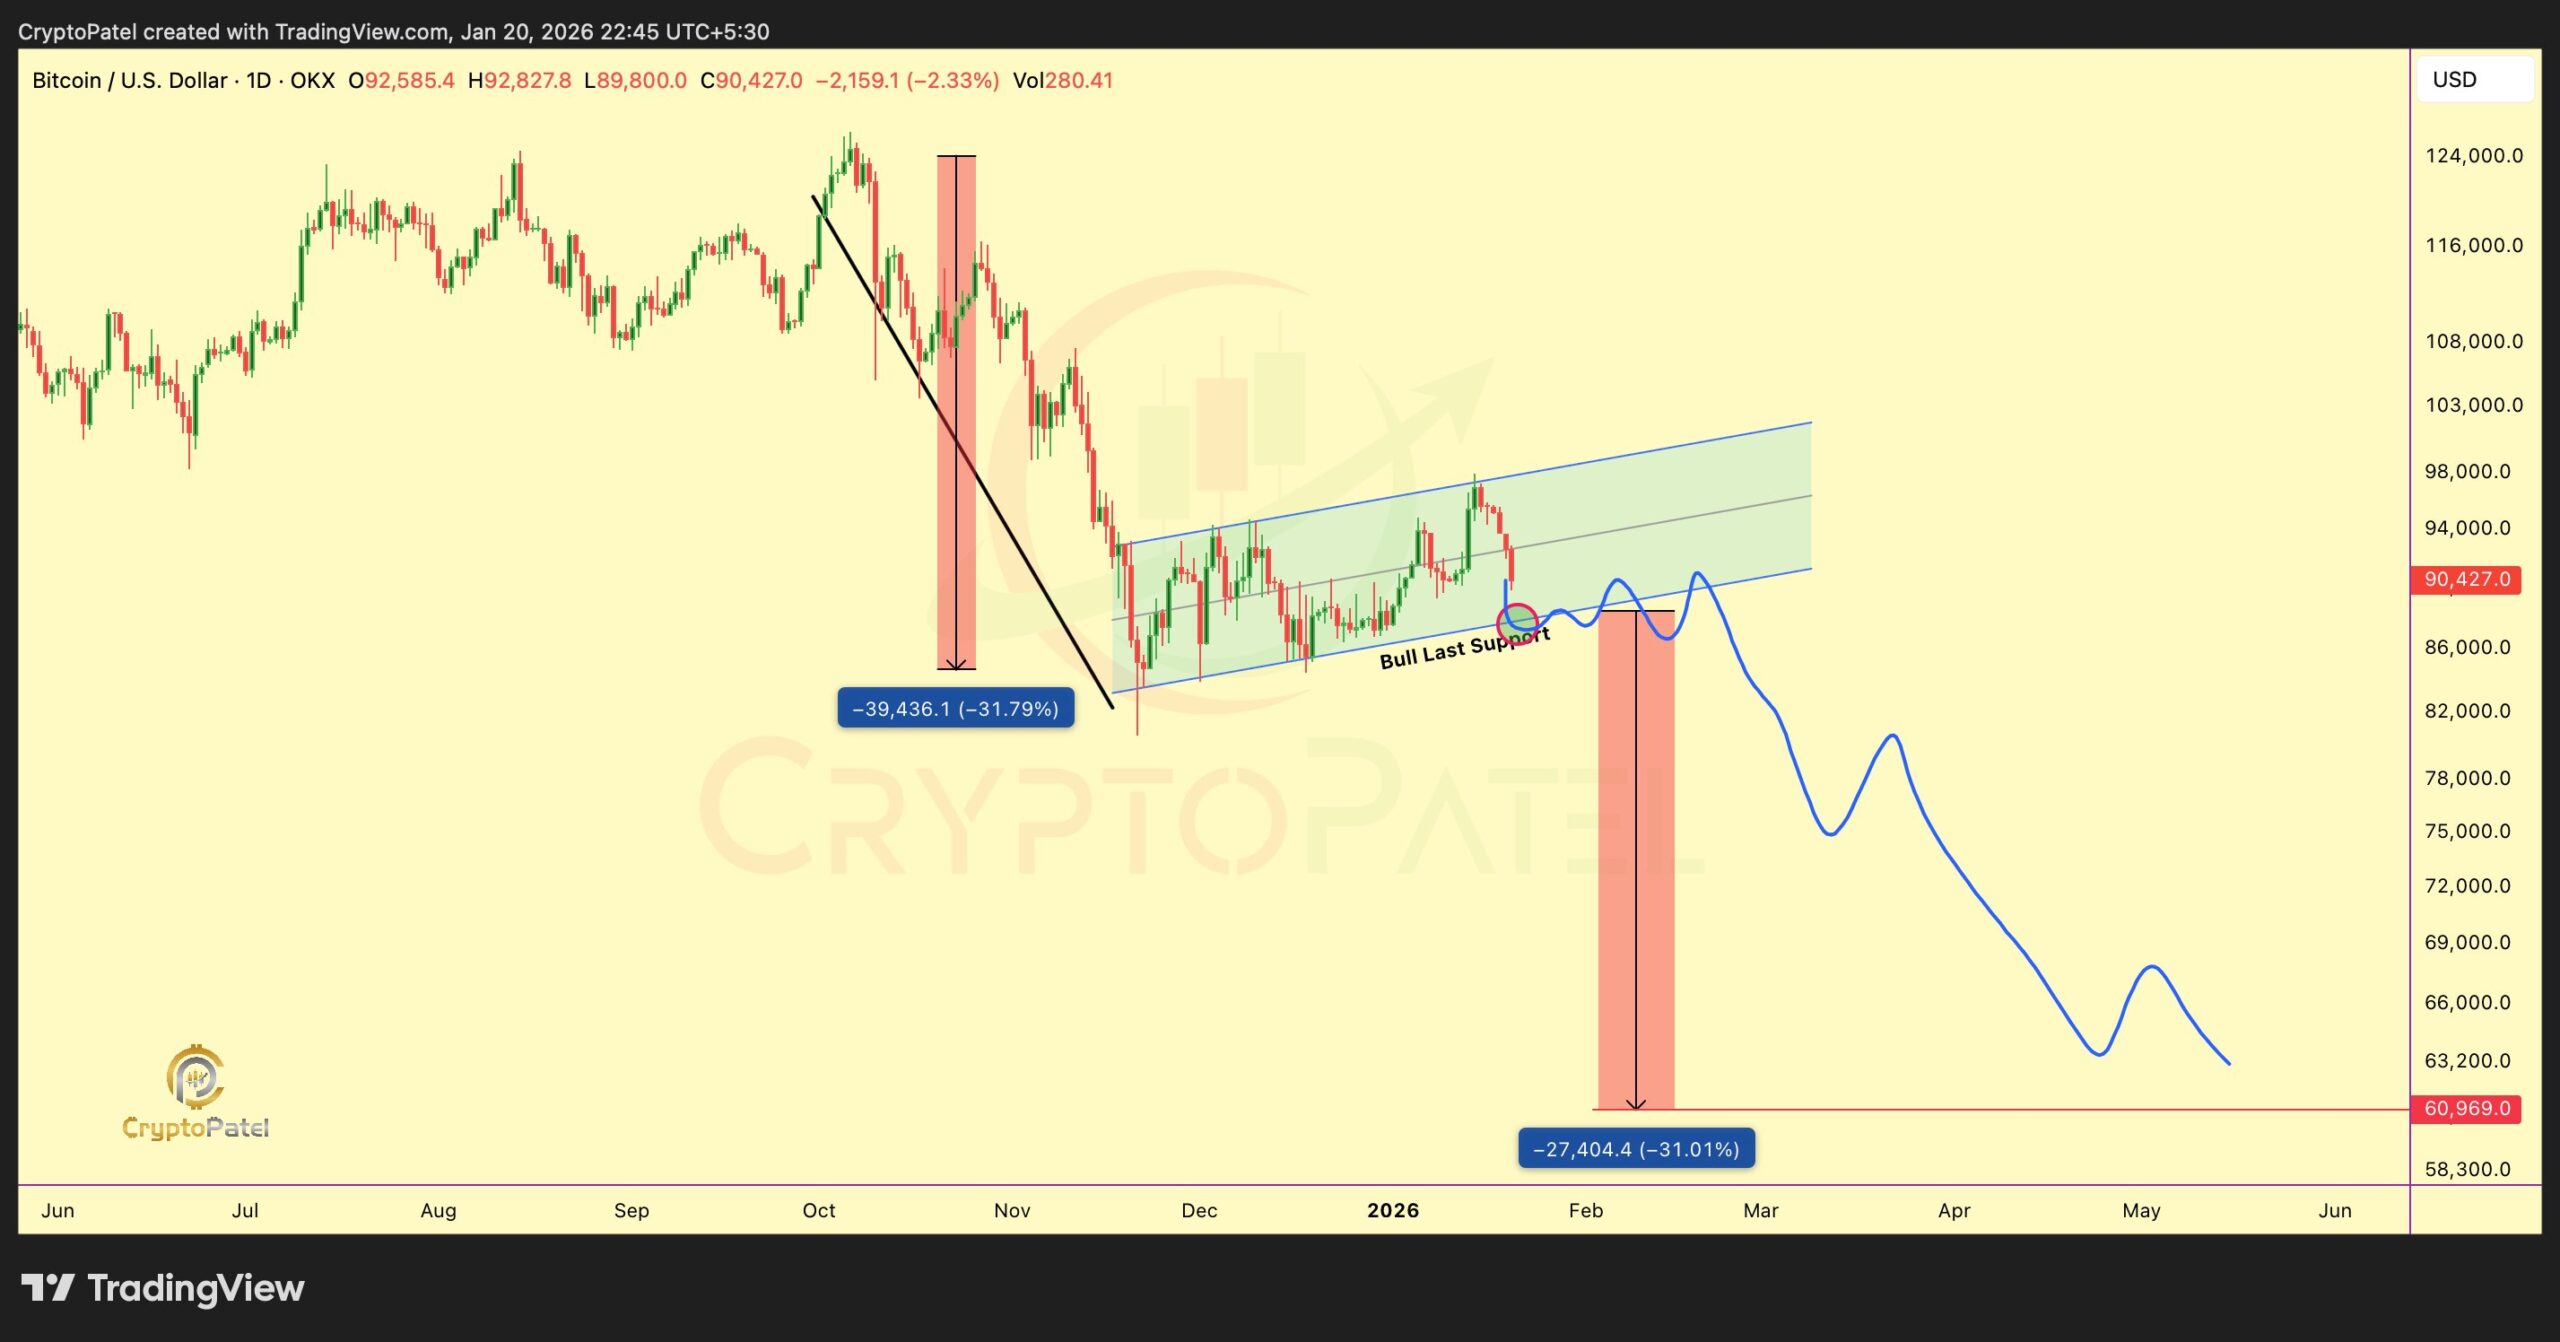
Patel noted that if the bulls manage a quick recovery above $90,000, it would weaken the bearish setup. It could lead to a failed breakdown or a potential bear trap.
On the other hand, yellow metal physical gold continues its strong rally amid rising geopolitical tensions. Bloomberg Intelligence analyst Mike McGlone warned that Bitcoin’s underperformance versus gold could become a key market signal heading into 2026.
He cited the clear disconnect between the Bitcoin-to-gold ratio alongside a record-setting U.S. stock market. McGlone added that in this framework, Bitcoin is emerging as a weaker asset. According to the analyst, the BTC-gold ratio will be a leading indicator to watch if equities begin to fall.
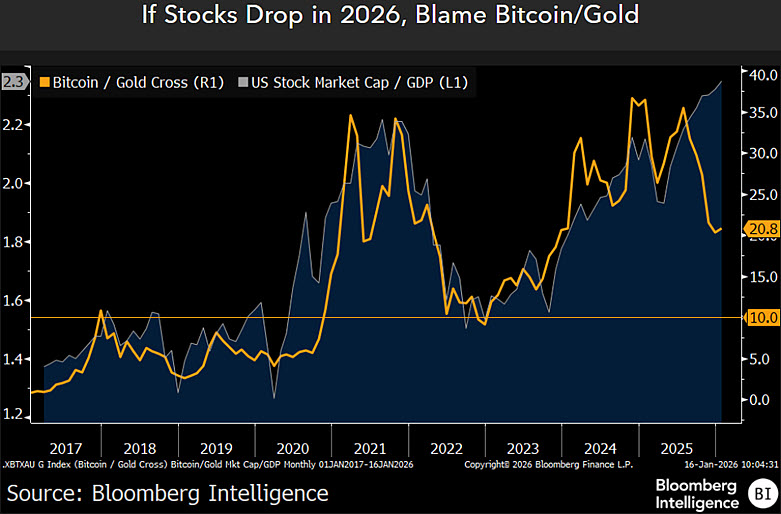
However, McGlone noted that even if stocks remain resilient, Bitcoin’s continued failure to recover relative to gold could still lead to bearish sentiment. It could lead to further breakdown of Bitcoin price support levels.
Bitcoin Price Reacts to Macro Shocks
On-chain data shows that the recent Bitcoin price pullback comes amid macro shocks and rising geopolitical tensions. Most of the major corrections over the past year are related to developments in major tariff and trade tensions.
During the first hit of the Trump tariff, i.e., ‘Liberation Day’ in April 2025, the Bitcoin price corrected by roughly 12%. Later in October. 25’, it corrected another 8% on renewed US-China trade tensions.
Earlier this month, in January, Bitcoin’s price corrected by 7% amid resurfacing U.S.–EU trade risks. The pattern reinforces the view that Bitcoin is being treated as a macro-sensitive risk asset.
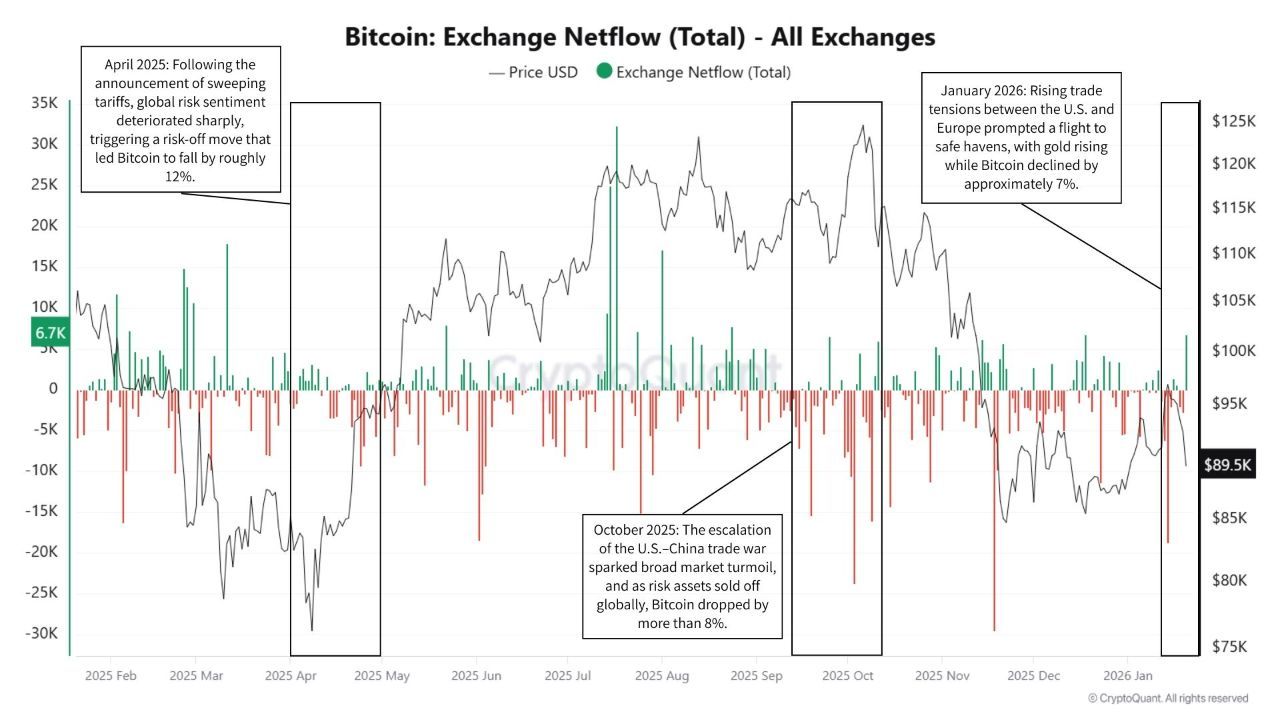
Despite the volatility, exchange flow data suggests selling pressure has not become sustained. Analysts said exchange net inflows spiked briefly during selloffs, but did not remain elevated long enough to indicate prolonged distribution. Instead, the flow pattern resembles short-term de-risking followed by absorption. This shows that BTC is currently facing macro-driven pressure rather than structural deterioration in demand.
BTC Whale Wallet Continues Accumulation
Amid this strong selling pressure, things might not be as bad as they seem. Blockchain analytics firm Santiment noted that BTC whale and shark wallets have continued their accumulation amid this fall.
Santiment reported that wallets holding between 10 and 10,000 BTC accumulated roughly 36,322 BTC over the past nine days, a 0.27% increase. In contrast, wallets holding less than 0.01 BTC reduced holdings by about 132 BTC over the same period, down 0.28%.
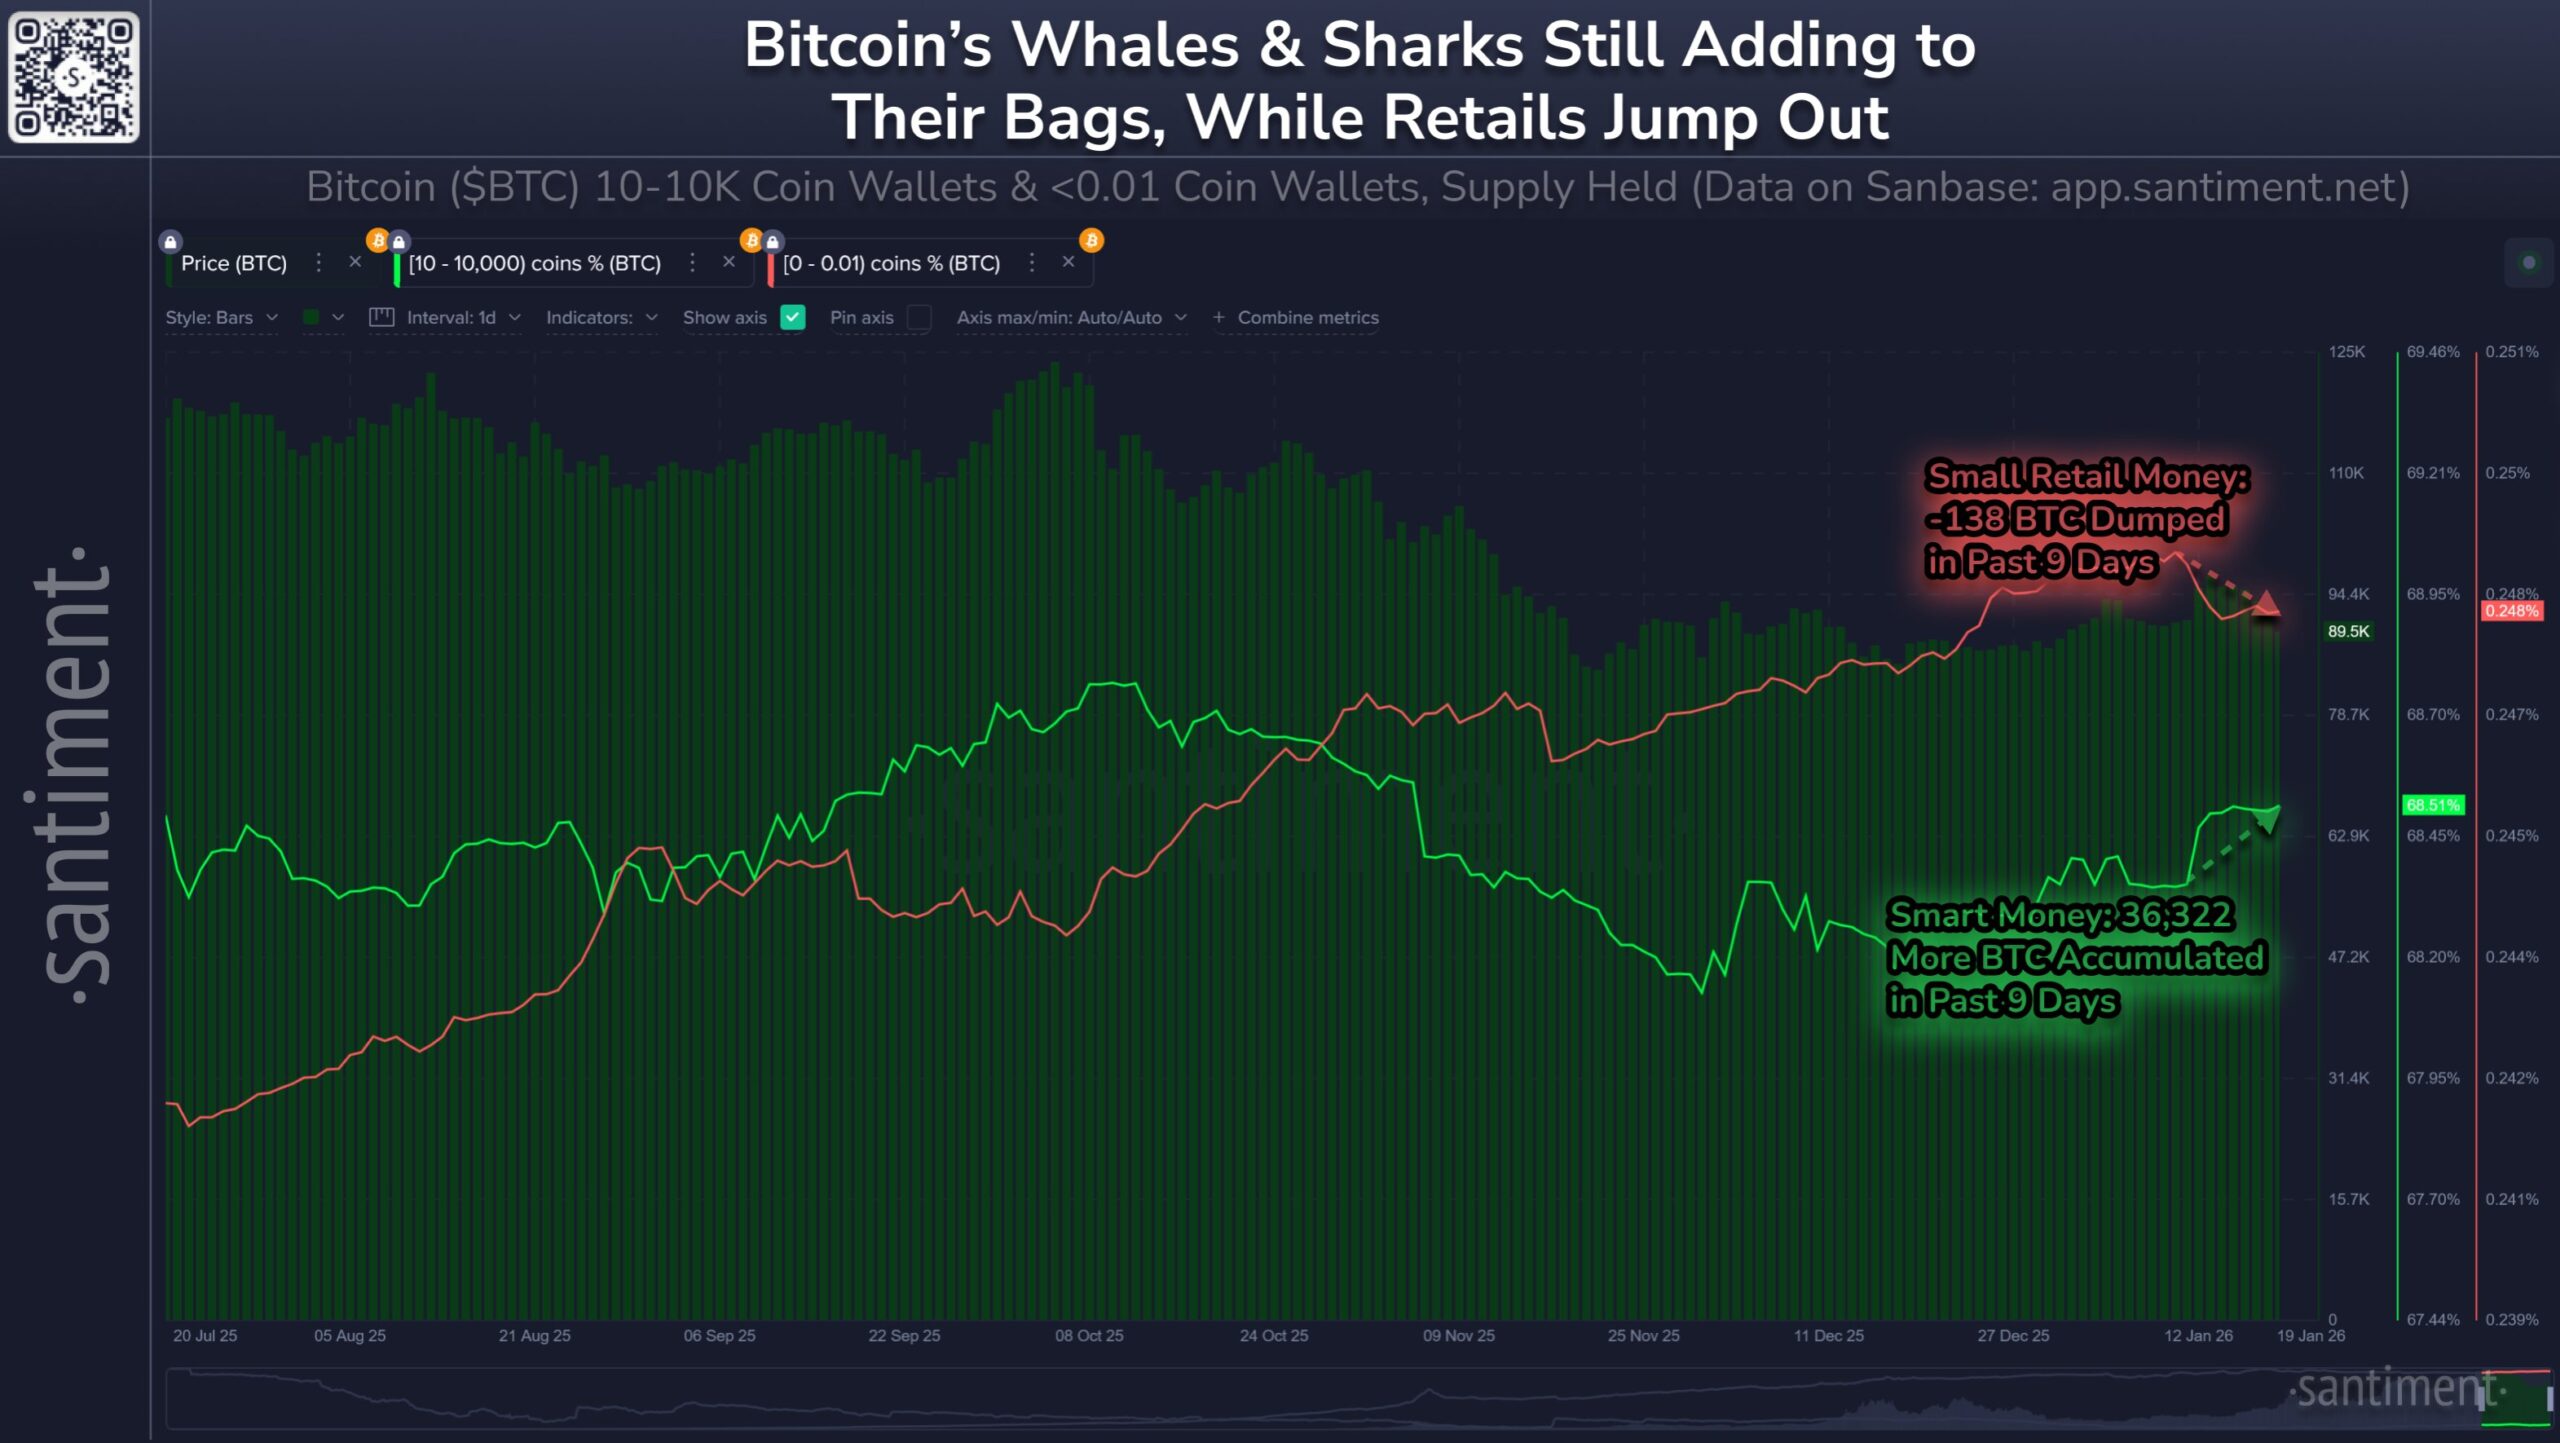
The firm noted that markets often see stronger upside setups when “smart money” accumulates while retail participants sell. Thus, the current distribution pattern is creating a longer-term bullish divergence despite ongoing geopolitical uncertainty.




