Wisp
Wisp Pearl
Pearl Doge Pepe
 Zylo Ecosystem
 Bunker Mode
 NEAR Protocol
 Crawlerpad

Solana price currently trades in a compression after the drastic drop, with SOL fluctuating between $75 and $92. SOL price is structurally pressured after a series of rejections near range resistance. Market reactions show consolidation rather than an established recovery. Analysts have shown aligned frameworks that are influencing the current Solana price prediction.
Range Breakdown Shapes Solana Price
Ali Charts noted that Solana price is in a bearish formation after an impulsive downside movement. The 4-hour chart shows consolidation within the $78-$92 range. This lateral range was formed due to aggressive selling. Price stability indicates a temporary balance as opposed to a structural recovery.
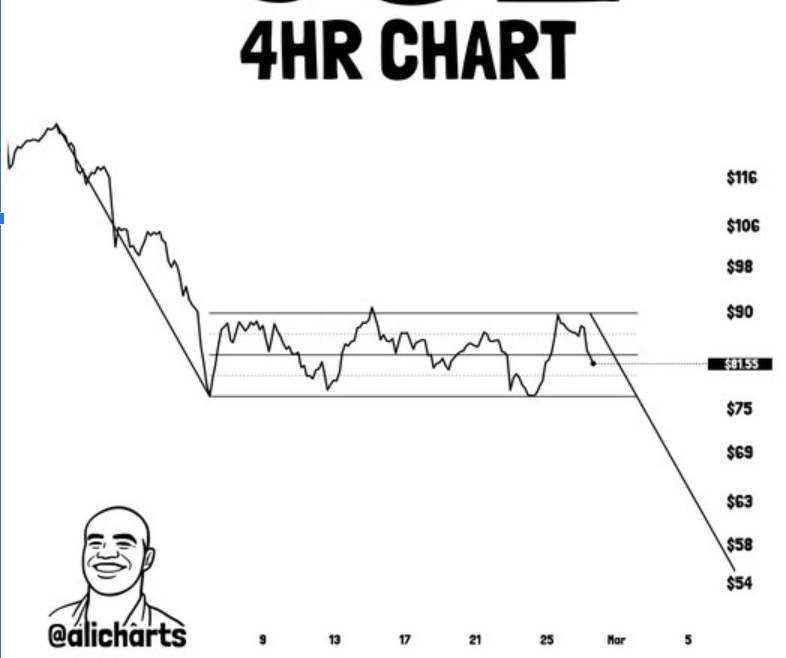
Further, supply dominance in this range is indicated around the $90 level. Higher lows keep forming below resistance, suggesting distribution conditions. The recent rejection confirms weakening momentum. Solana’s price is moving toward the middle of the range, around $81, under downward pressure.
Additionally, the chart represents a defined downside projection after support failure. A decisive move below $78 triggers a target near $65. This projection reflects the historical impulsive leg lower.
Moreover, the structure of the range is similar to a bear flag that is within a major downward trend. Directional expansion normally follows distribution behavior. Structural weakness persists until resistance near $92 is reclaimed. The asset remains vulnerable while trading beneath the range resistance.
Solana Price Prediction Defined by Consolidation
Meanwhile, Satoshi Flipper presented a horizontal consolidation structure on the SOL against USDT chart. Price is oscillating within a rectangular range between $75 and $92. The structure formed after a sharp liquidation, with liquidity falling below its lower boundary.
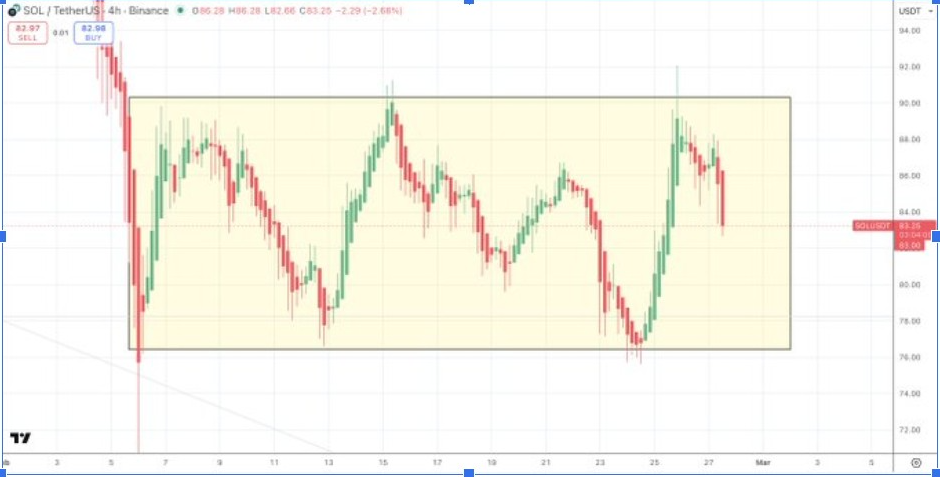
Equal highs and lows define liquidity concentration on both sides of the range. Repeated tests confirm well-defined boundaries. The recent rally toward $90 encountered a strong rejection. This indicates a persistent overhead supply across the range.
Furthermore, consolidation often precedes directional expansion. A breakout above $92 would indicate an upward expansion. On the other hand, a decline below $75 would suggest increased selling pressure. Solana price remains compressed within structural equilibrium.
In addition, the framework emphasizes patience while the market remains range-bound. Until directional resolution occurs, price behavior reflects a balance between demand and supply. Also, the asset remains structurally neutral within defined limits.
Support Test Anchors Solana Price Outlook
According to Jussy, Solana approaches a historically significant support zone on the weekly timeframe. The chart highlights major cyclical bottoms forming near similar horizontal levels. The key structural support spans the $60 to $80 zone. This zone previously preceded expansion cycles.
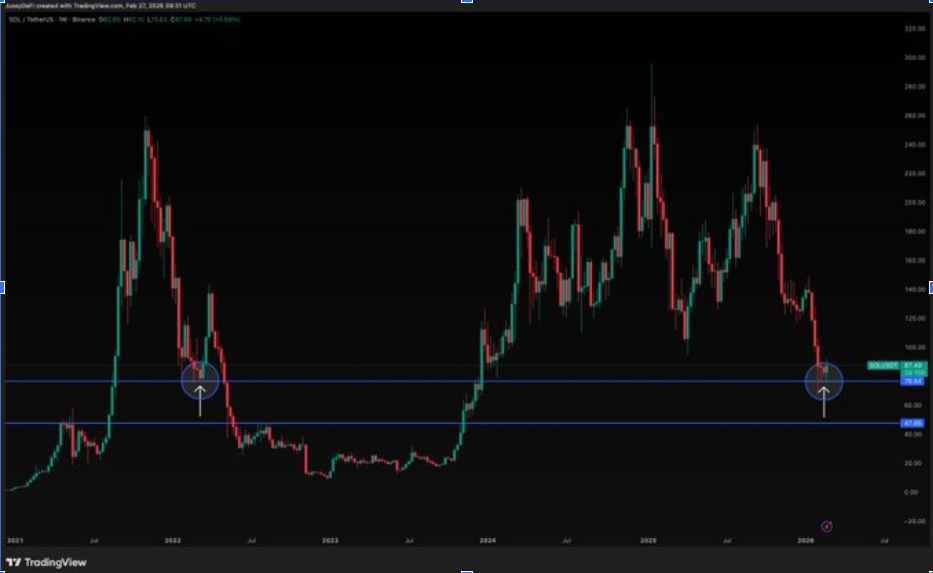
The decline from 2025 highs returned the price toward this historical demand level. Structural symmetry appears between past and present cycle positioning. Holding this support could initiate a new accumulation phase. Solana’s price is now in a macro decision zone.
Moreover, the previous cycle demonstrated strong expansion after defending this level. The framework places greater weight on horizontal support than on short-term volatility. Accumulation would be verified by the continued presence of higher lows. Such macrostructural defenses generally react to the greater crypto market.
Additionally, there would be a loss of cyclical symmetry if this demand zone is not held. A breakdown below support could extend corrective pressure. Moreover, the weekly model outlines the current positioning within long-term repetitive patterns. The asset’s reaction near historical support remains structurally decisive.