
 Puffer
 ZKsync
 Bitcoin
 NEAR Protocol
 Pearl
Pearl Quantus
 Sui
Sui

Dogecoin is trading within a tight range, with technical and on-chain indicators aligning for a potential breakout position. Current charts place DOGE close to a long-held support level, whereas the targets to the upside are above the recent range. At the same time, network participation has accelerated sharply, with active addresses rising 176% in one week. That combination has brought fresh attention to the Dogecoin price and whether the current consolidation can lead to a stronger move.
Dogecoin Price Holds Firm in Accumulation Range
According to Crypto_Jobs, the Dogecoin price remains inside a horizontal consolidation structure that has held for several weeks. The chart shows repeated reactions from the same support area, marked by a black horizontal line near the lower boundary.
Each return to that level has attracted buyers, keeping the market from breaking lower. In that framework, the current DOGE price is still sitting inside an accumulation zone rather than a breakdown pattern.
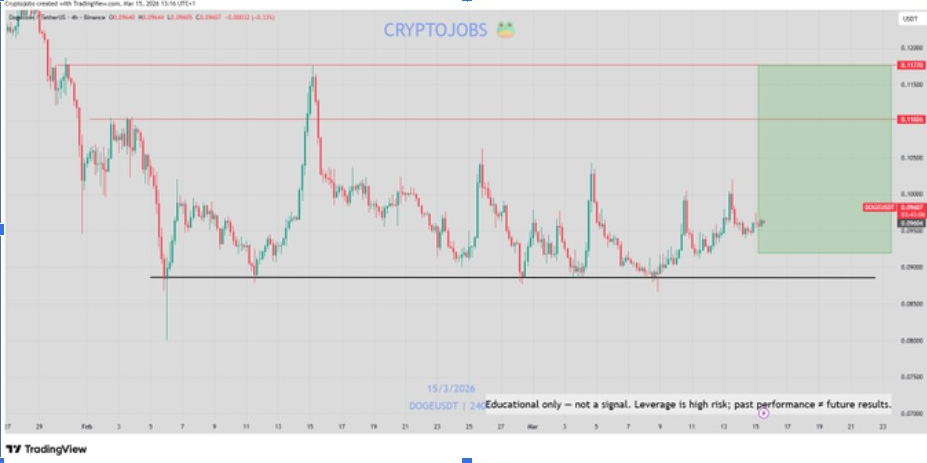
One notable feature is the repeated defense of support after sharp dips. The lower band has been tested several times, yet the price recovered from that point. Such reactions usually imply absorption of the supply with time. The market would then be able to gain momentum towards a decisive direction as the range matures and resistance weakens.
Additionally, the chart indicates the overhead resistance zones using horizontal red lines over the existing price. These point to the subsequent levels of resistance that DOGE must overcome to confirm a larger bullish trend. Until then, Dogecoin price remains in preparation mode, with support acting as the main technical anchor.
Falling Wedge Points to DOGE-BTC Rotation Setup
Trader Tardigrade’s chart shifts the focus to Dogecoin against Bitcoin on the weekly timeframe. The pair is trading within a falling wedge, formed by converging lower highs and lower lows. This trend is usually followed as a potential reversal formation following a prolonged downward trend. Here, the tightening wedge suggests that the Dogecoin price may have reached a critical point in its relative trend to Bitcoin.
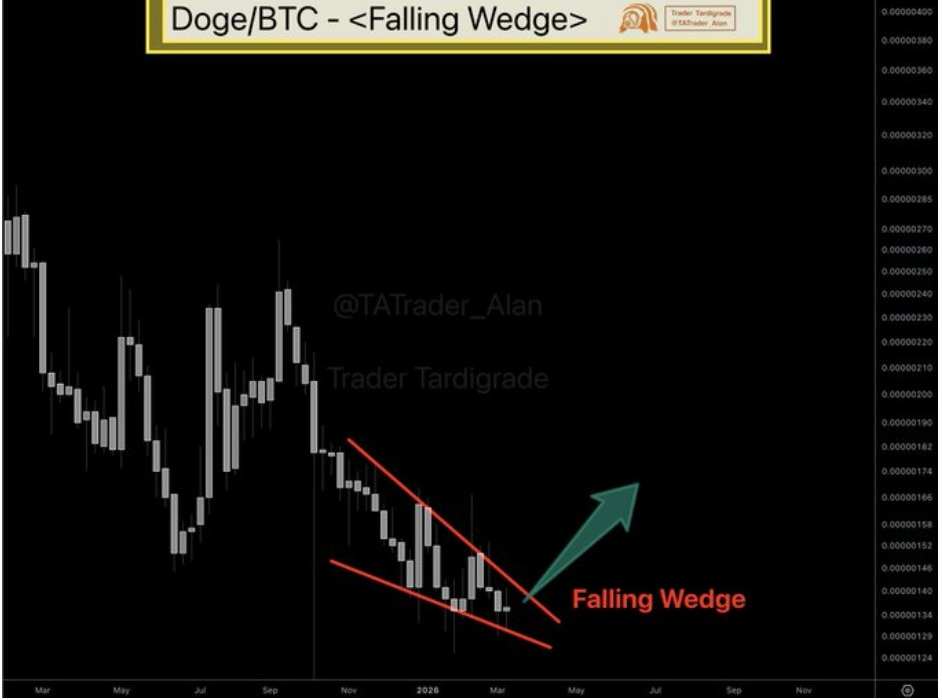
The narrowing distance between the wedge boundaries is one of the most important details on the chart. As the pattern compresses, the price usually moves closer to a breakout decision. According to the analyst, an upward break could signal capital rotation into Dogecoin from Bitcoin. That would matter because relative strength often supports broader market attention toward an asset.
Moreover, the lower boundary of the wedge has been tested several times without yielding. Repeated support tests strengthen the significance of the pattern on a weekly chart. DOGE price could retest the upper boundary as traders expect stronger momentum or volume to confirm a breakout. If that happens, the DOGE price could benefit from improving sentiment across relative markets as well.
Network Activity Surge Adds Momentum to DOGE Price
Ali Charts adds an on-chain layer to the market picture by focusing on active addresses. The chart shows Dogecoin’s active addresses rising from 41,557 to 114,662 over one week, a 176% increase. That kind of increase points to a strong rise in network participation. While it is not a price chart, it helps explain why attention around the Dogecoin price has started to build again.
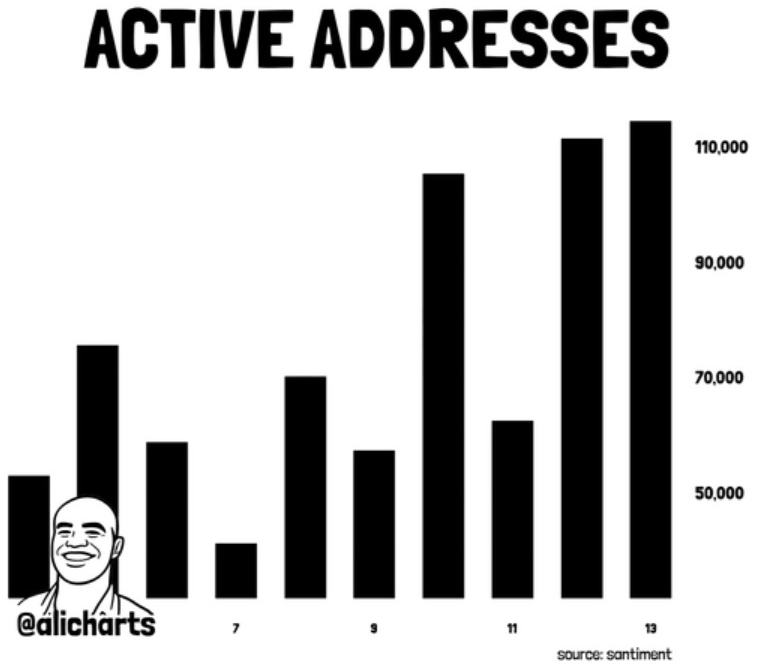
Rising active addresses often signal growing engagement across a blockchain network. The address activity is highly active, indicating that more people are participating in Dogecoin activity than in the past few weeks. This is very important, as on-chain activity can attract further trading, especially when technical setups are forming.
Furthermore, the timing of this increase is notable. The network activity spike is occurring as DOGE is located within a technical accumulation zone and as the DOGE versus BTC wedge is narrowing. Traders are also likely to become more vigilant in a scenario where technical structures and on-chain participation patterns happen to trend in the same direction.


