Doge Pepe
 Wisp
Wisp Bunker Mode
 Pearl
Pearl Sonic
Sonic Pudgy Penguins
 Zylo Ecosystem

Ethereum price has gone sideways since February this year as the crypto winter continued. ETH token is showing some bottoming signs. This means that it may rebound in the coming days or weeks as ETF inflows jump and the US-Iran ceasefire continues.
Ethereum Price Chart Points to a Rebound
The daily chart shows that the ETH price may have bottomed, which will lead to a rebound in the near term.
The coin flipped the Supertrend indicator from red to green on March 15. It has stayed in the green zone since then. In most cases, a green Supertrend indicator sends a signal that the tide is turning, leading to a strong comeback.
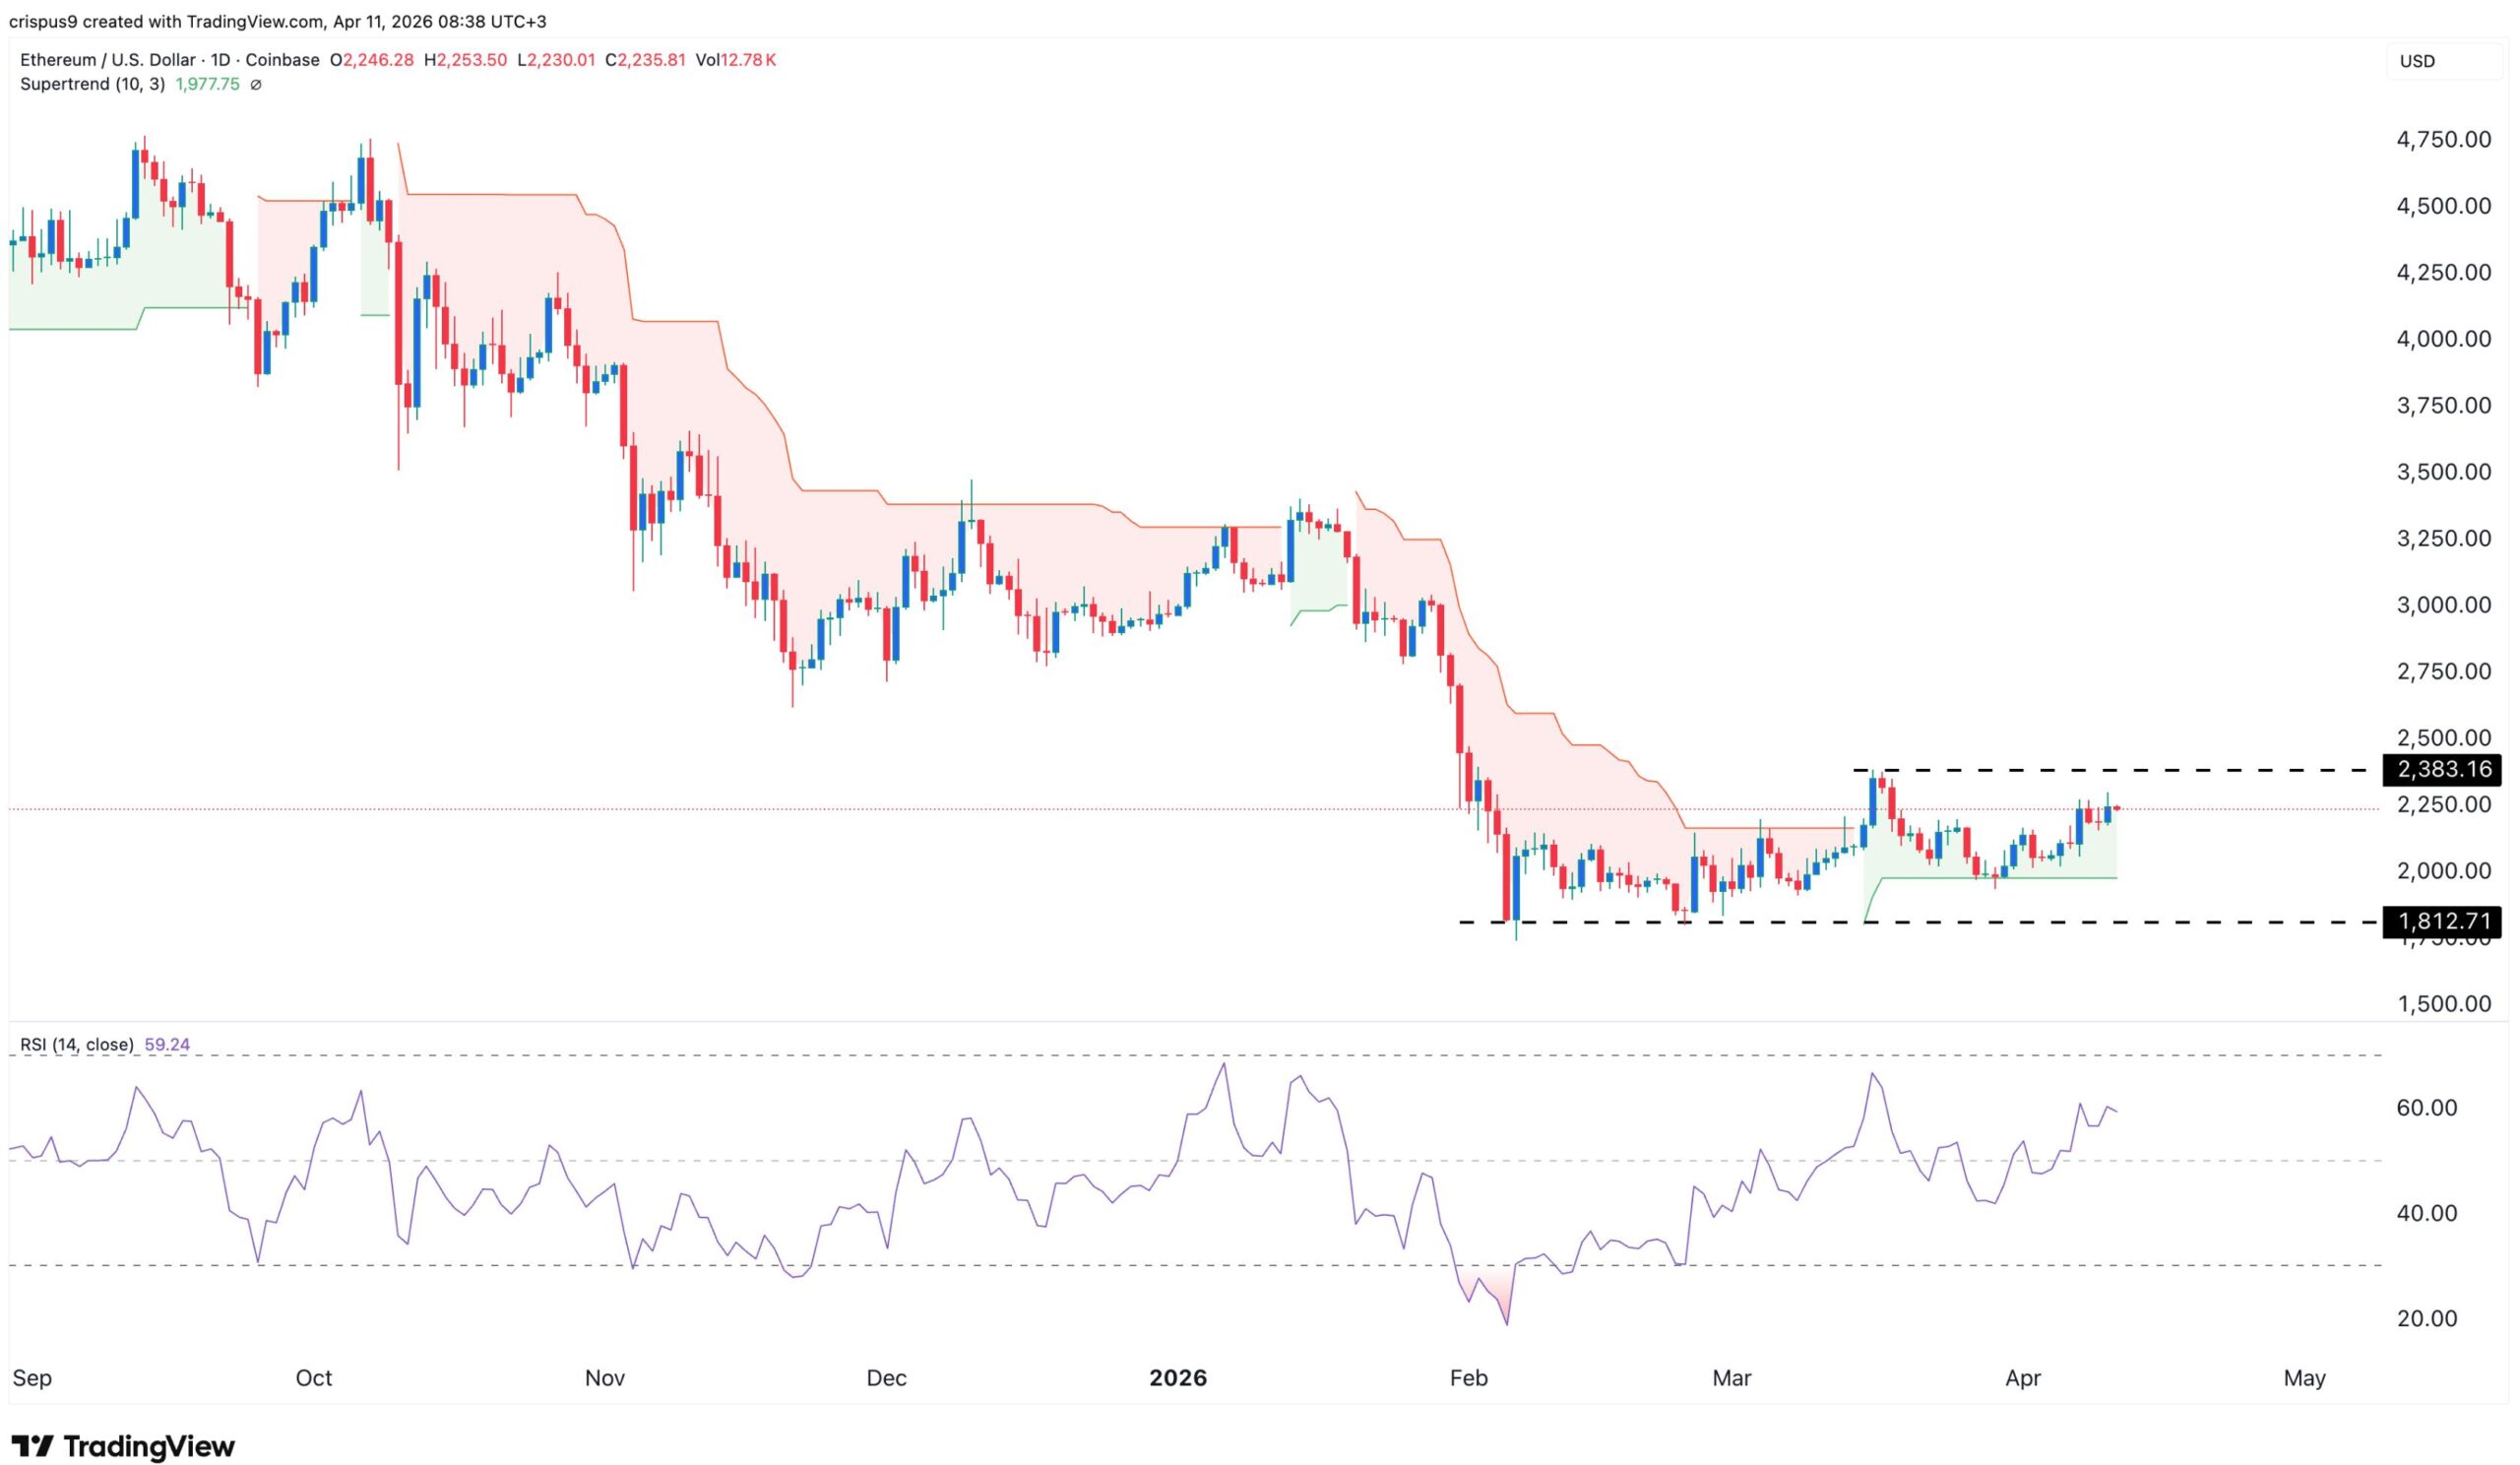
The coin has also jumped above the 50-day Exponential Moving Average (EMA). Also, the Relative Strength Index (RSI) has jumped from the oversold level of 18 to 60, which is a sign of a bullish divergence.
Ethereum price has also formed a double-bottom pattern whose neckline is at $2,383. Therefore, these patterns mean that the token will have a strong bullish breakout in the coming weeks.
This view will be confirmed if it moves above the neckline at $2,383. If this happens, it may jump to the psychological level at $3,000.
ETH Price Has Formed an Inverted Head-and-Shoulders Pattern
Meanwhile, the weekly chart is also pointing to a strong rebound this year. The chart shows that it has formed an inverted head-and-shoulders pattern, which often leads to a reversal.
It has already completed the left shoulder and the head, and is now forming the right shoulder section. Also, the Relative Strength Index (RSI) has risen from the oversold level of 30 to the current 41.
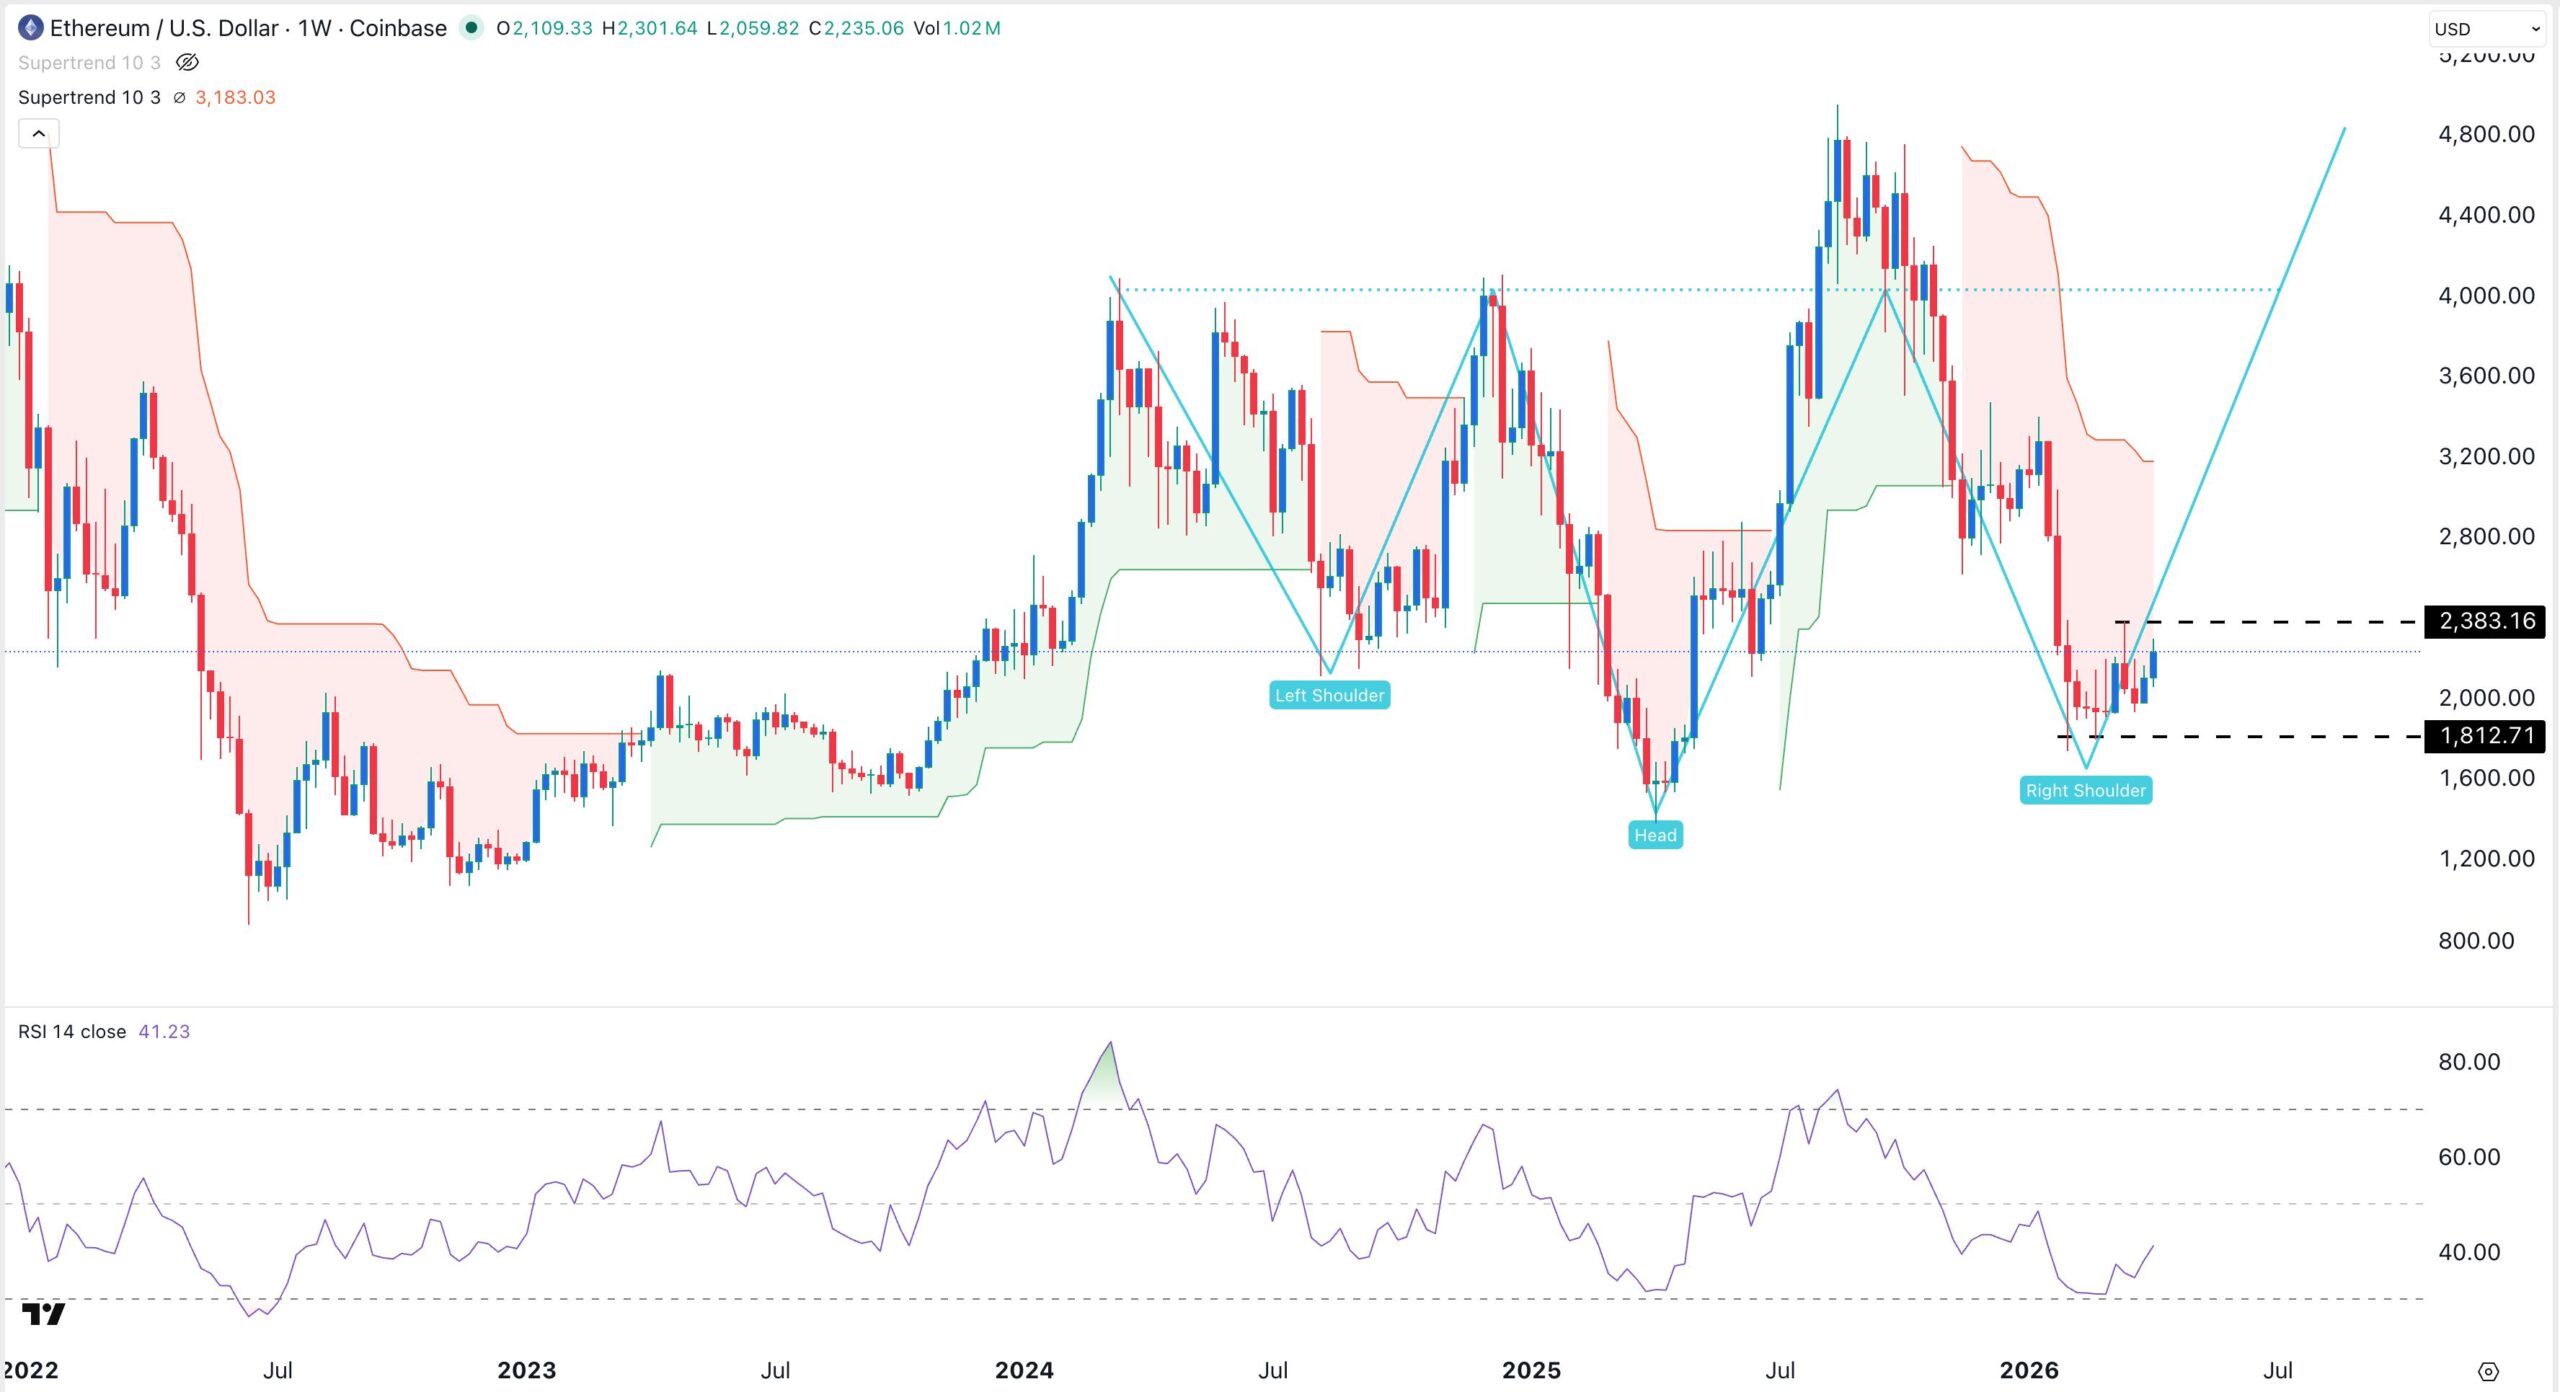
Therefore, the bullish outlook will remain as long as it is above the key support level at $1,812. That’s the lower side of the right shoulder.
Spot Ethereum ETFs Inflows Jumped
Fundamentals also support an Ethereum rebound. Data compiled by SoSoValue shows that American investors bought Ethereum ETFs last week.
These funds added over $187 million in assets this week, bringing the cumulative net inflows to $11.6 billion. The inflow was a positive reversal after they shed assets in the previous three consecutive weeks.
Ethereum ETF inflows have risen by over $108 million this month. That’s also important as they lost assets in the previous five straight months. This is a sign that market participants have started to accumulate the token, which they believe is highly undervalued.
More data show that Ethereum’s network is thriving despite the ongoing crypto winter. For example, the stablecoin supply jumped to over $176 billion. This is notable since the industry holds about $308 billion in assets. This gives it a market dominance rate of over 50%.
Ethereum network handled $1.01 trillion in stablecoin volume as the number of addresses rose to 6.3 million.
Additionally, there are signs that demand remains resilient. Tom Lee’s BitMine has already bought over 4.8 million ETH tokens since July last year and is moving towards the 6 million goal.
According to CoinGlass, the supply of ETH tokens on exchanges has dropped to a multi-year low of 12.16 million. This is a significant deceleration from last year’s high of nearly 18 million tokens.
Falling exchange supply is a sign that investors are still accumulating the token and moving it to their self-custody wallets.
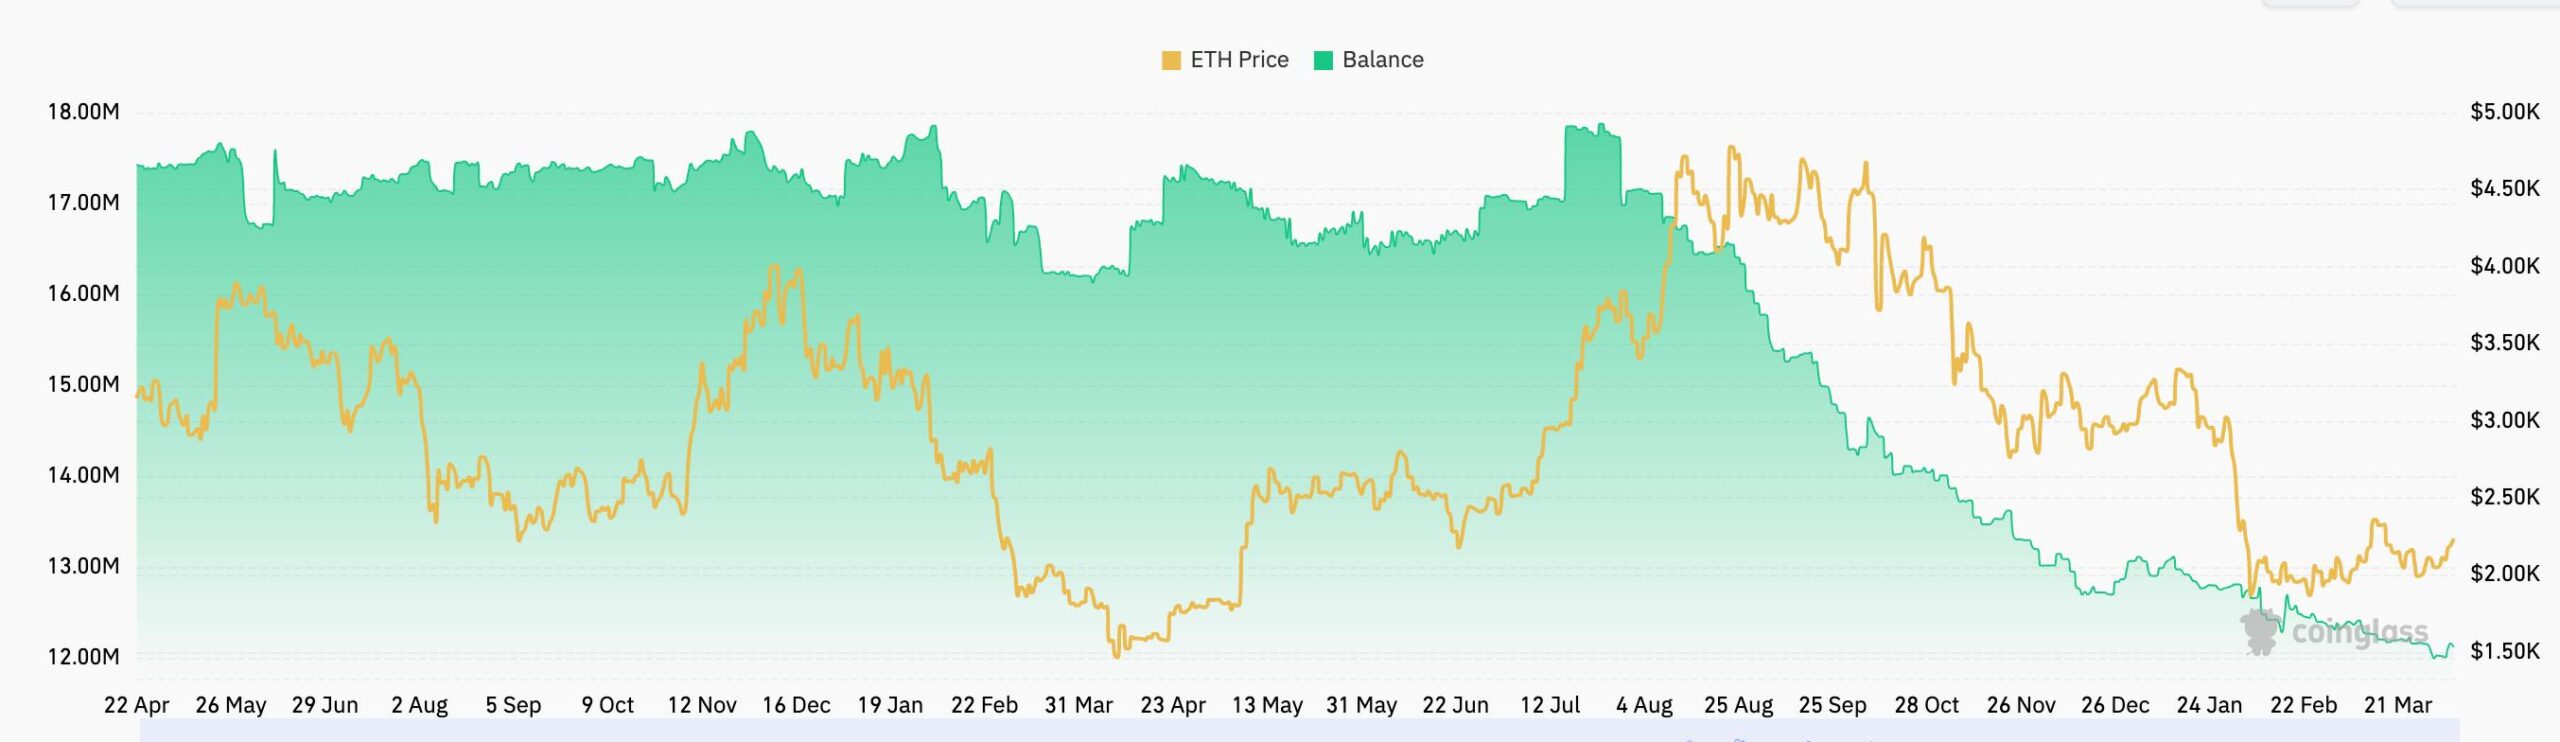
One major reason why this is happening is that investors are staking their tokens. The staking ratio has jumped to 30%, while the staking queue has jumped to a record high.
Therefore, these bullish metrics mean that Ethereum price will likely bounce back in the coming days as investors buy the dip. This rally, however, will depend on whether the ceasefire between the United States of America and Iran will hold.