Doge Pepe
 Crawlerpad
 Zylo Ecosystem
 Quant
Quant Starknet
 NEAR Protocol
 Sonic
Sonic

The S&P 500 Index surged into a strong bull run this week. It hovered near its all-time high as earnings season advanced and hopes of a US–Iran truce lifted sentiment.
It jumped to $7,022, up sharply from the March low of $6,304. So, will the Bitcoin price follow and retest its all-time high?
S&P 500 Index driven by dip buying, earnings season, and US-Iran Truce
The blue-chip S&P 500 Index has climbed steadily in recent weeks. Other top American indices like the Dow Jones and Nasdaq 100 have also performed well, and analysts suggest the trend may continue.
This rally has accelerated this week amid the ongoing truce between the US and Iran. Analysts believe that the two sides will reach an agreement in the coming days or weeks. This agreement may extend the ceasefire that started last week.
Even if the fighting returns, the hope is that it will eventually end later this year. That’s in the interest of the three sides. Such a move will lead to lower crude oil prices, inflation expectations, and potential for federal reserve interest rate cuts.
The S&P 500 Index has soared as investors went bargain hunting. Many scooped up cheap software stocks that had plunged recently amid fears of AI disruption. Some top software stocks like Microsoft, Adobe, and ServiceNow have all soared sharply in the past few weeks.
The earnings season started strong as Goldman Sachs and JPMorgan reported impressive results. Their trading business played a major role in driving those numbers higher. ASML, a top player in the chips industry, also released strong numbers as demand for its products jumped.
Investors have continued to buy S&P 500 Index ETFs. Vanguard’s VOO and State Street’s SPYM added over $60 billion combined, showing strong demand for broad market exposure.
Spot Bitcoin ETFs Add Assets as Accumulation Continues & Bitcoin Price Outlook Strengthens
American investors have continued to accumulate Bitcoin ETFs. This signaled confidence in a recovery of the Bitcoin price this year.
Data shows that spot Bitcoin ETFs added over $186 million in assets on Wednesday after adding $411 million a day earlier. These funds added $928 million in assets this month. The newly launched MSBT already holds over $106 million, showing strong investor interest.
If this trend continues, it will be the second consecutive month of ETF inflows. The inflows trajectory will likely cross last month’s $1.32 billion. This is a major development as the funds shed assets to four consecutive months before that.
These ETFs have now had $57 billion in inflows since their inception, with their total assets being $97 billion.
The Bitcoin ETF market is set to become more active in the coming months. BlackRock and Goldman Sachs will launch unique funds designed to pay investors a double-digit return.
These funds are different from the existing spot Bitcoin ETFs because of how they are structured. Instead of just holding Bitcoin, these funds actively use the covered call strategy to generate returns. They distribute those returns to investors each month, creating a steady income stream.
Bitcoin Price Technical Analysis
Bitcoin price rebounded earlier this month after bottoming at $64,957. It then surged to $75,000, marking a key resistance level. The move placed the price along the upper side of the ascending channel. Traders now watch closely to see if it can break higher.
The coin has moved above the 50-day Exponential Moving Average, a sign that bulls are prevailing. Also, it is about to flip the key resistance level at $76,000, the neckline of the double-bottom pattern.
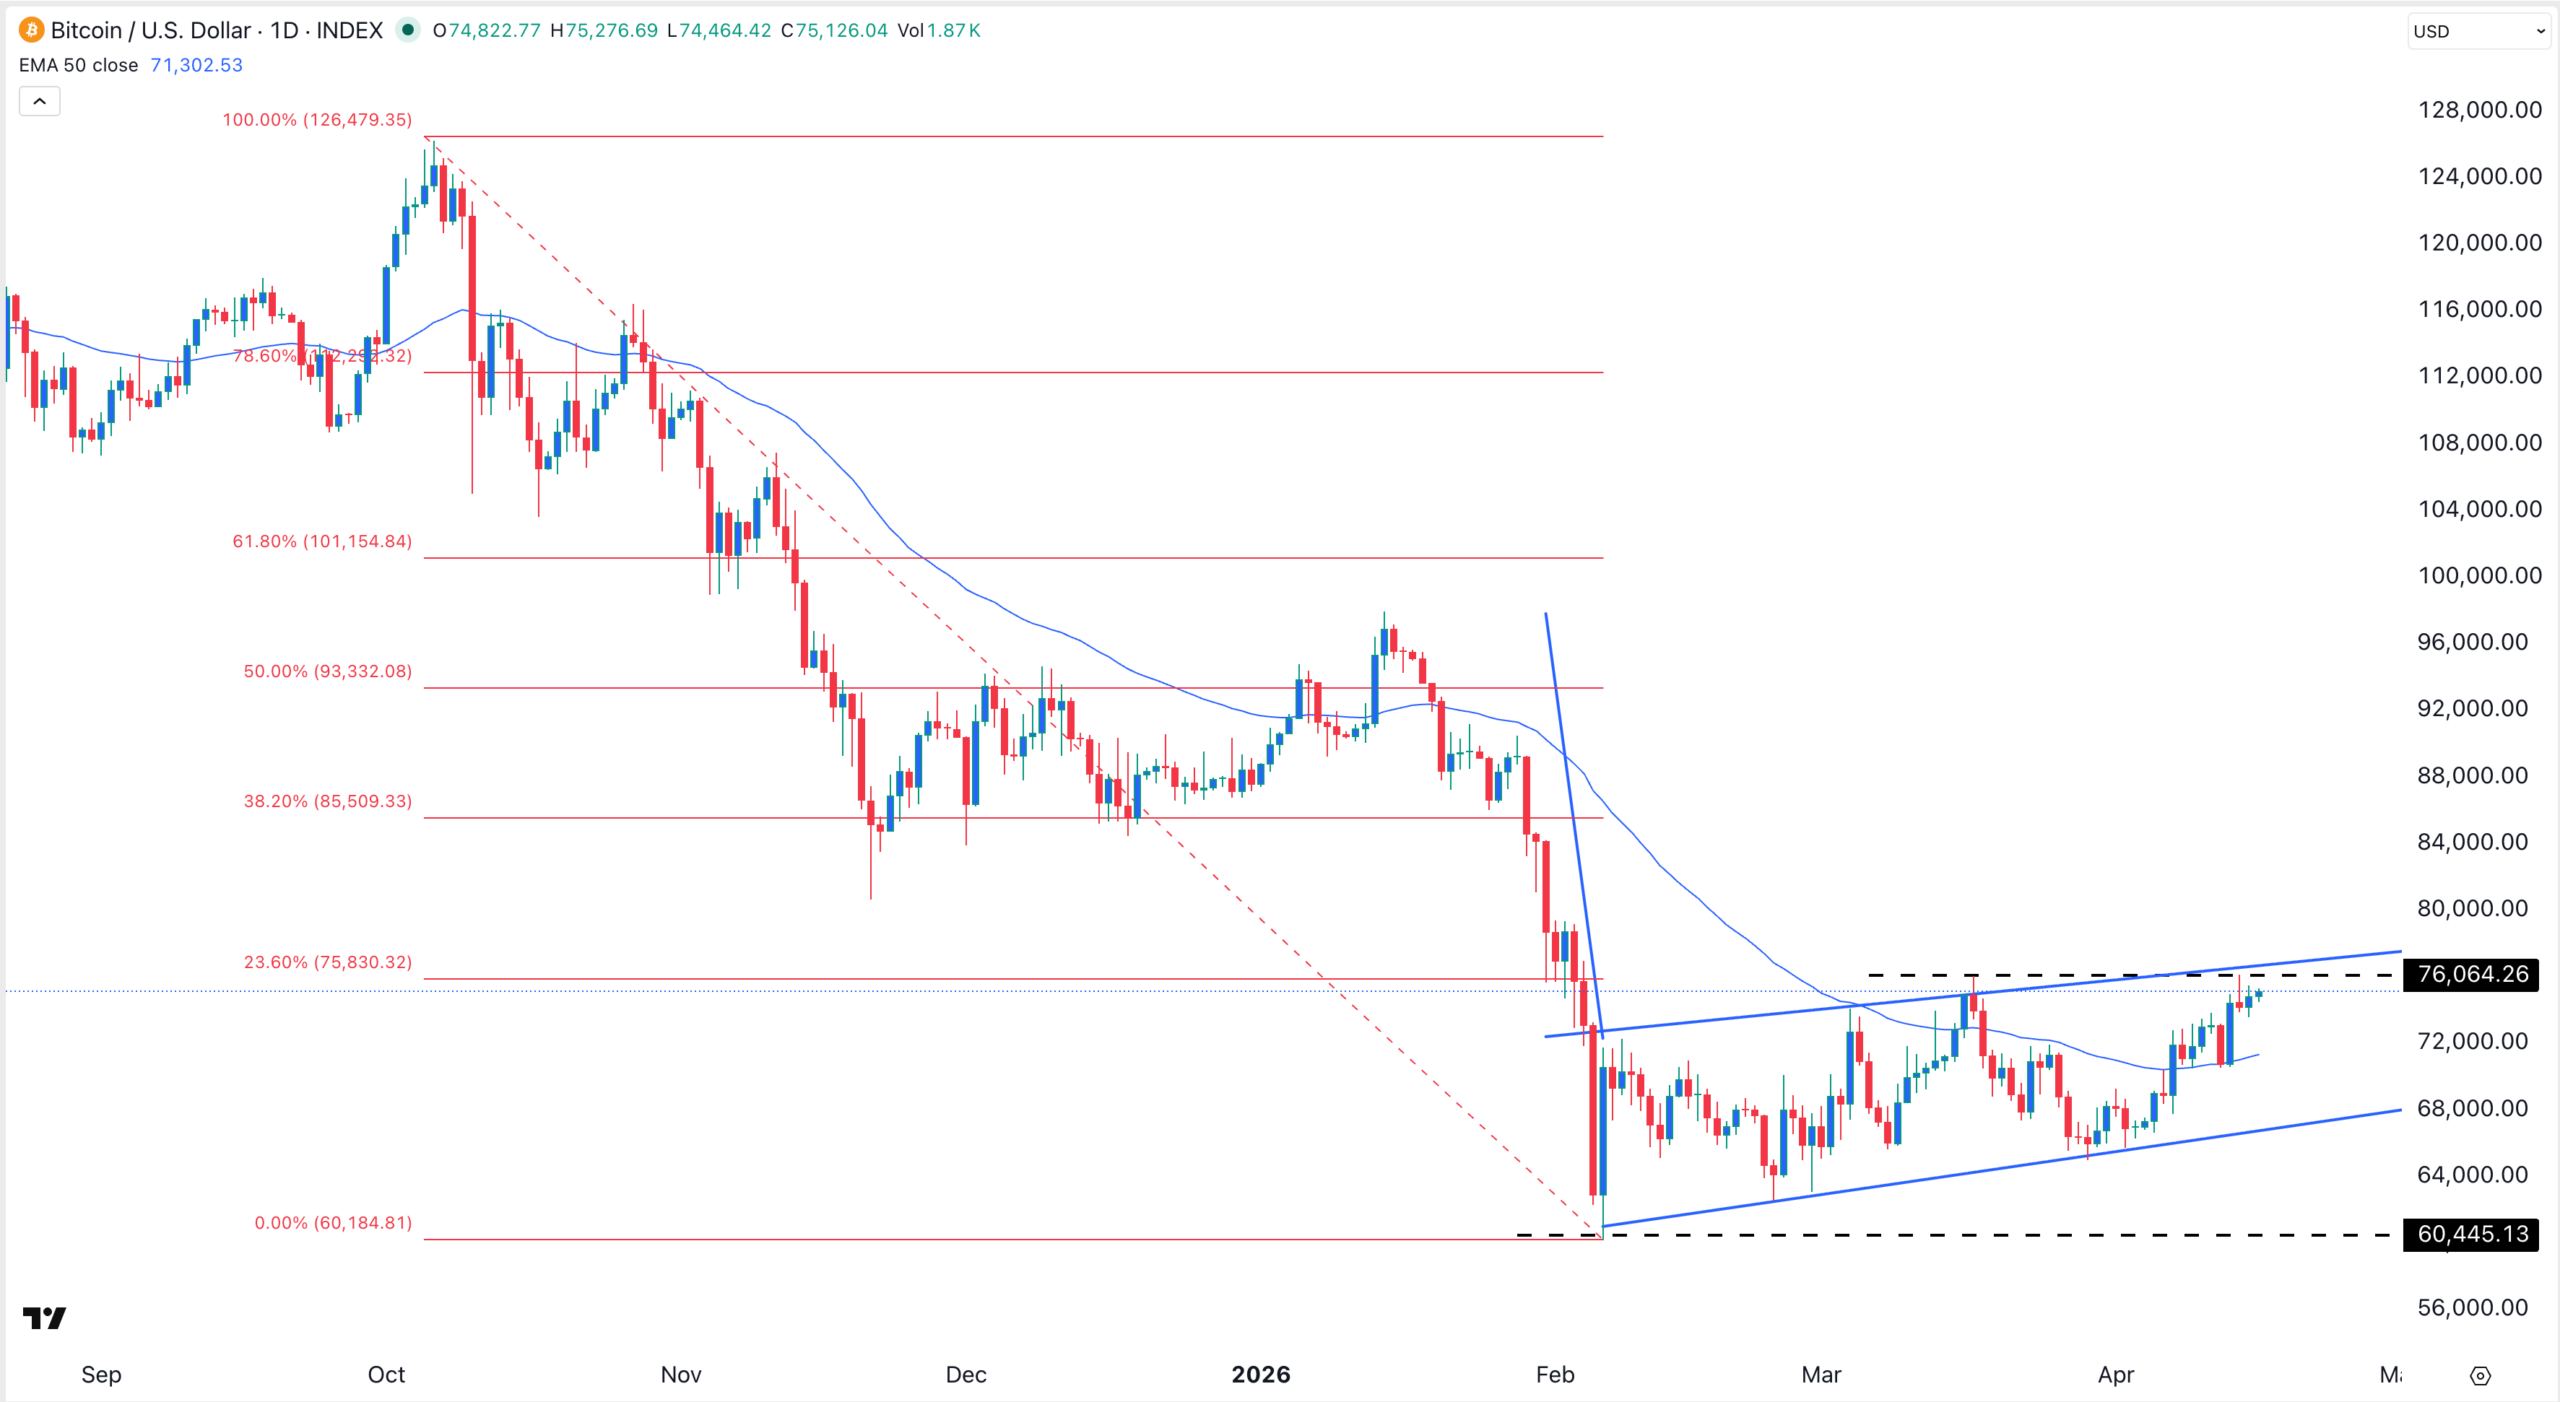
The path of least resistance for Bitcoin price points upward. Its next key target is the 50% Fibonacci Retracement level at $93,300.
A move above that price will point to more gains, potentially to the psychological level at $100,000. However, a drop below the 50-day moving average at $71,300 will invalidate the bullish outlook.