
 Bitcoin
 Ondo
Ondo NEAR Protocol
 Walrus
 Pearl
Pearl Pons
Pons Ethereum

Bitcoin price made a bullish breakout on Wednesday, reaching its highest level since February 3 this year. BTC was trading at $78,000, up sharply from the year-to-date low of $60,000. This rally may continue as ETF inflows jump.
Spot Bitcoin ETFs are Nearing a $2 Billion Milestone
There are signs that Bitcoin accumulation is continuing this month. This may lead to a strong bullish breakout in the coming weeks or months.
One of these signs is that spot Bitcoin ETFs have continued seeing substantial inflows this month. They added $11 million on Tuesday, bringing this month’s inflow to $1.87 billion. If this trend continues, it means that these funds will get to $2 billion.
Bitcoin ETFs have added $250 million this week and are in the fourth consecutive week in the green.
They added $1.32 billion last month, bucking a dangerous trend in which they lost assets for four consecutive months.
Data shows that they lost over $6.29 billion in November, December, January, and February. As a result, the last two months’ inflows have pared back about half of what was lost in those four months.
The ongoing Bitcoin ETF Inflows is important as it is sending signals of increased buying by institutional investors. They believe that the coin may have bottomed.
Another possible reason is that investors are now selling gold ETFs and moving to Bitcoin funds. Data shows that the popular SPDR Gold ETF (GLD) has shed over $1.3 billion in assets this year. With this, most to the outflow happened in March.
Spot Bitcoin ETFs may see more demand now that Goldman Sachs and Blackrock are working on separate funds. These funds would pay investors monthly dividends. These Bitcoin ETFs will leverage the covered call strategy to generate returns.
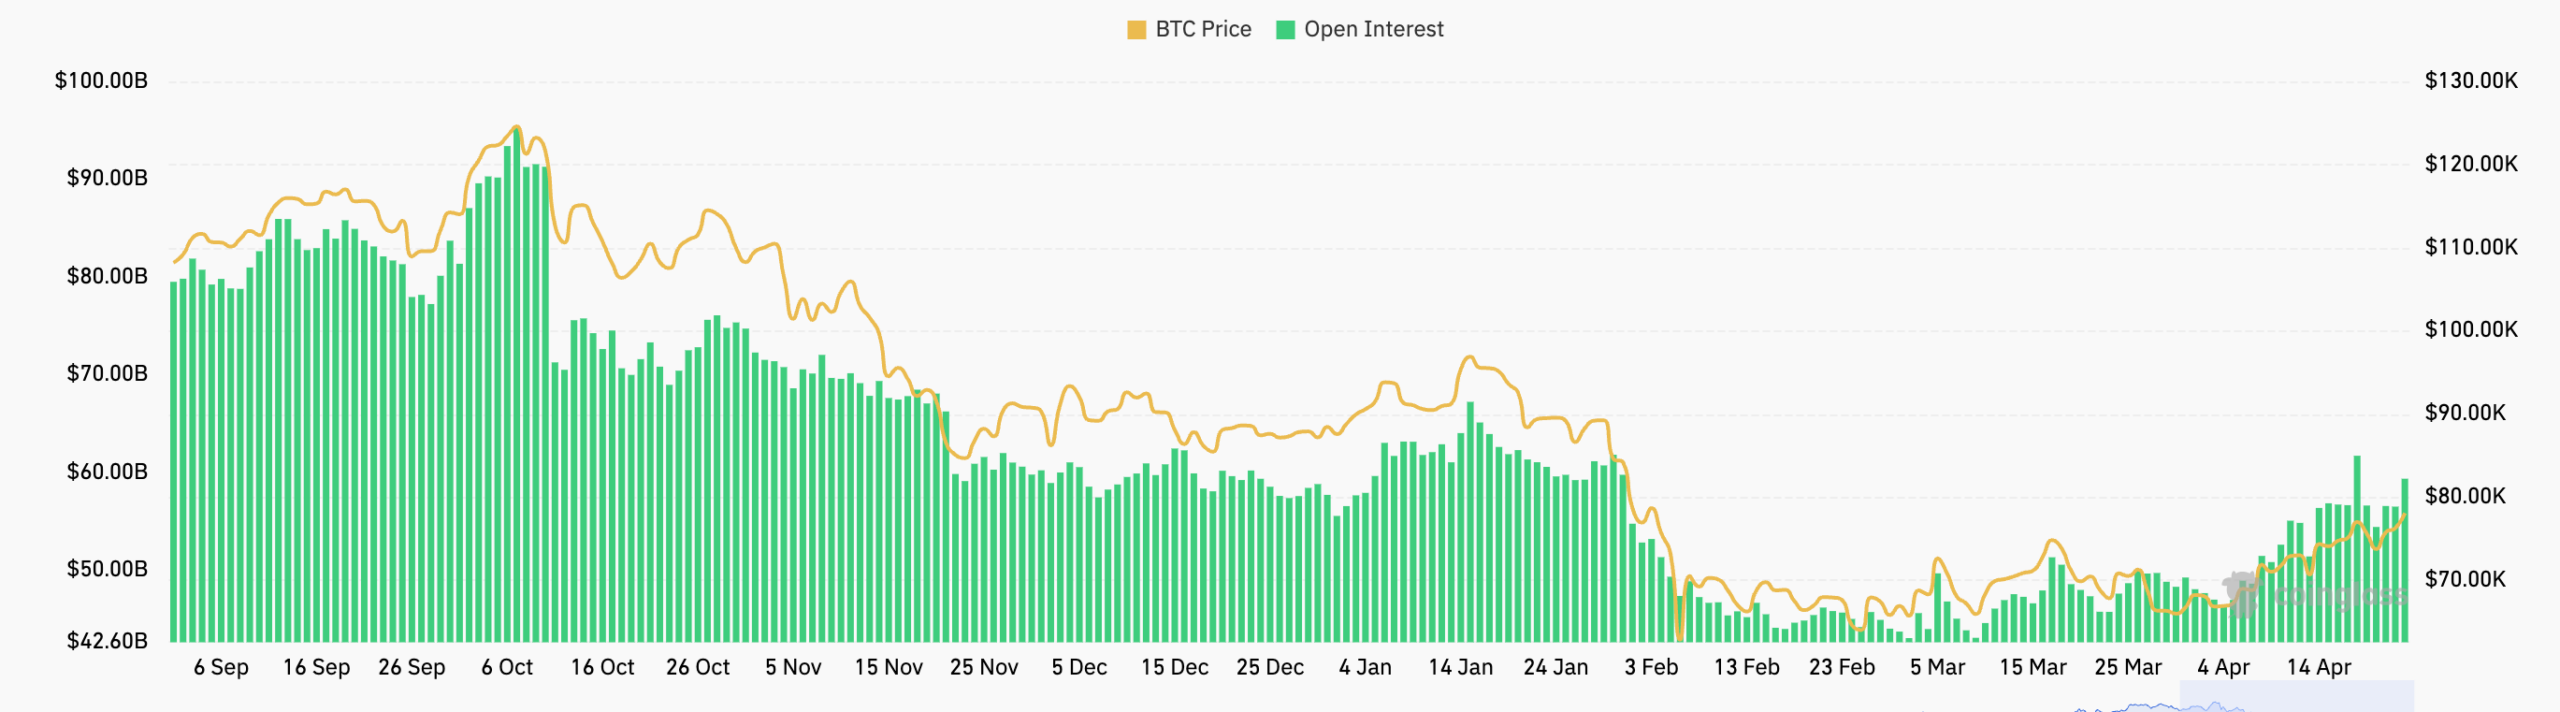
Another sign of increased Bitcoin demand is happening in the futures market. There, data is showing that open interest has continued rising this week. Per CoinGlass, the futures open interest rose to $60 billion on Wednesday, the highest level since April 18. At that time, it rose to $61 billion.
US Extends Iran Ceasefire
The ongoing Bitcoin price rally is happening after President Trump announced that he would extend the two-week Iran ceasefire indefinitely. This happened as Iran refused to meet with his team of negotiators who included JD Vance, Jared Kushner, and Steve Witkoff.
Iran argued the talks would be meaningless. It said the US continues its aggression by blockading ports and announcing more sanctions.
The ceasefire extension means that the Strait of Hormuz will still be closed, which may push crude oil prices higher. Indeed, Brent and West Texas Intermediate (WTI) prices jumped after the extension.
The other implication is that Iran may launch an attack to provoke the US into a prolonged conflict. Besides, this ceasefire was called by Trump without the Iranian input. A prolonged war would be bearish for Bitcoin and other risky assets.
Bitcoin Price Technical Analysis
The daily timeframe chart shows that Bitcoin price has been crawling back in the past few weeks. It has just crossed the important resistance level at $76,200. This price is the upper side of the ascending triangle pattern, which normally leads to more gains.
The coin has already flipped the Supertrend indicator from red to green. However, the Relative Strength Index (RSI) has formed an ascending channel and is nearing the overbought level. The Aroon Oscillator has continued rising and is hovering at the overbought level.
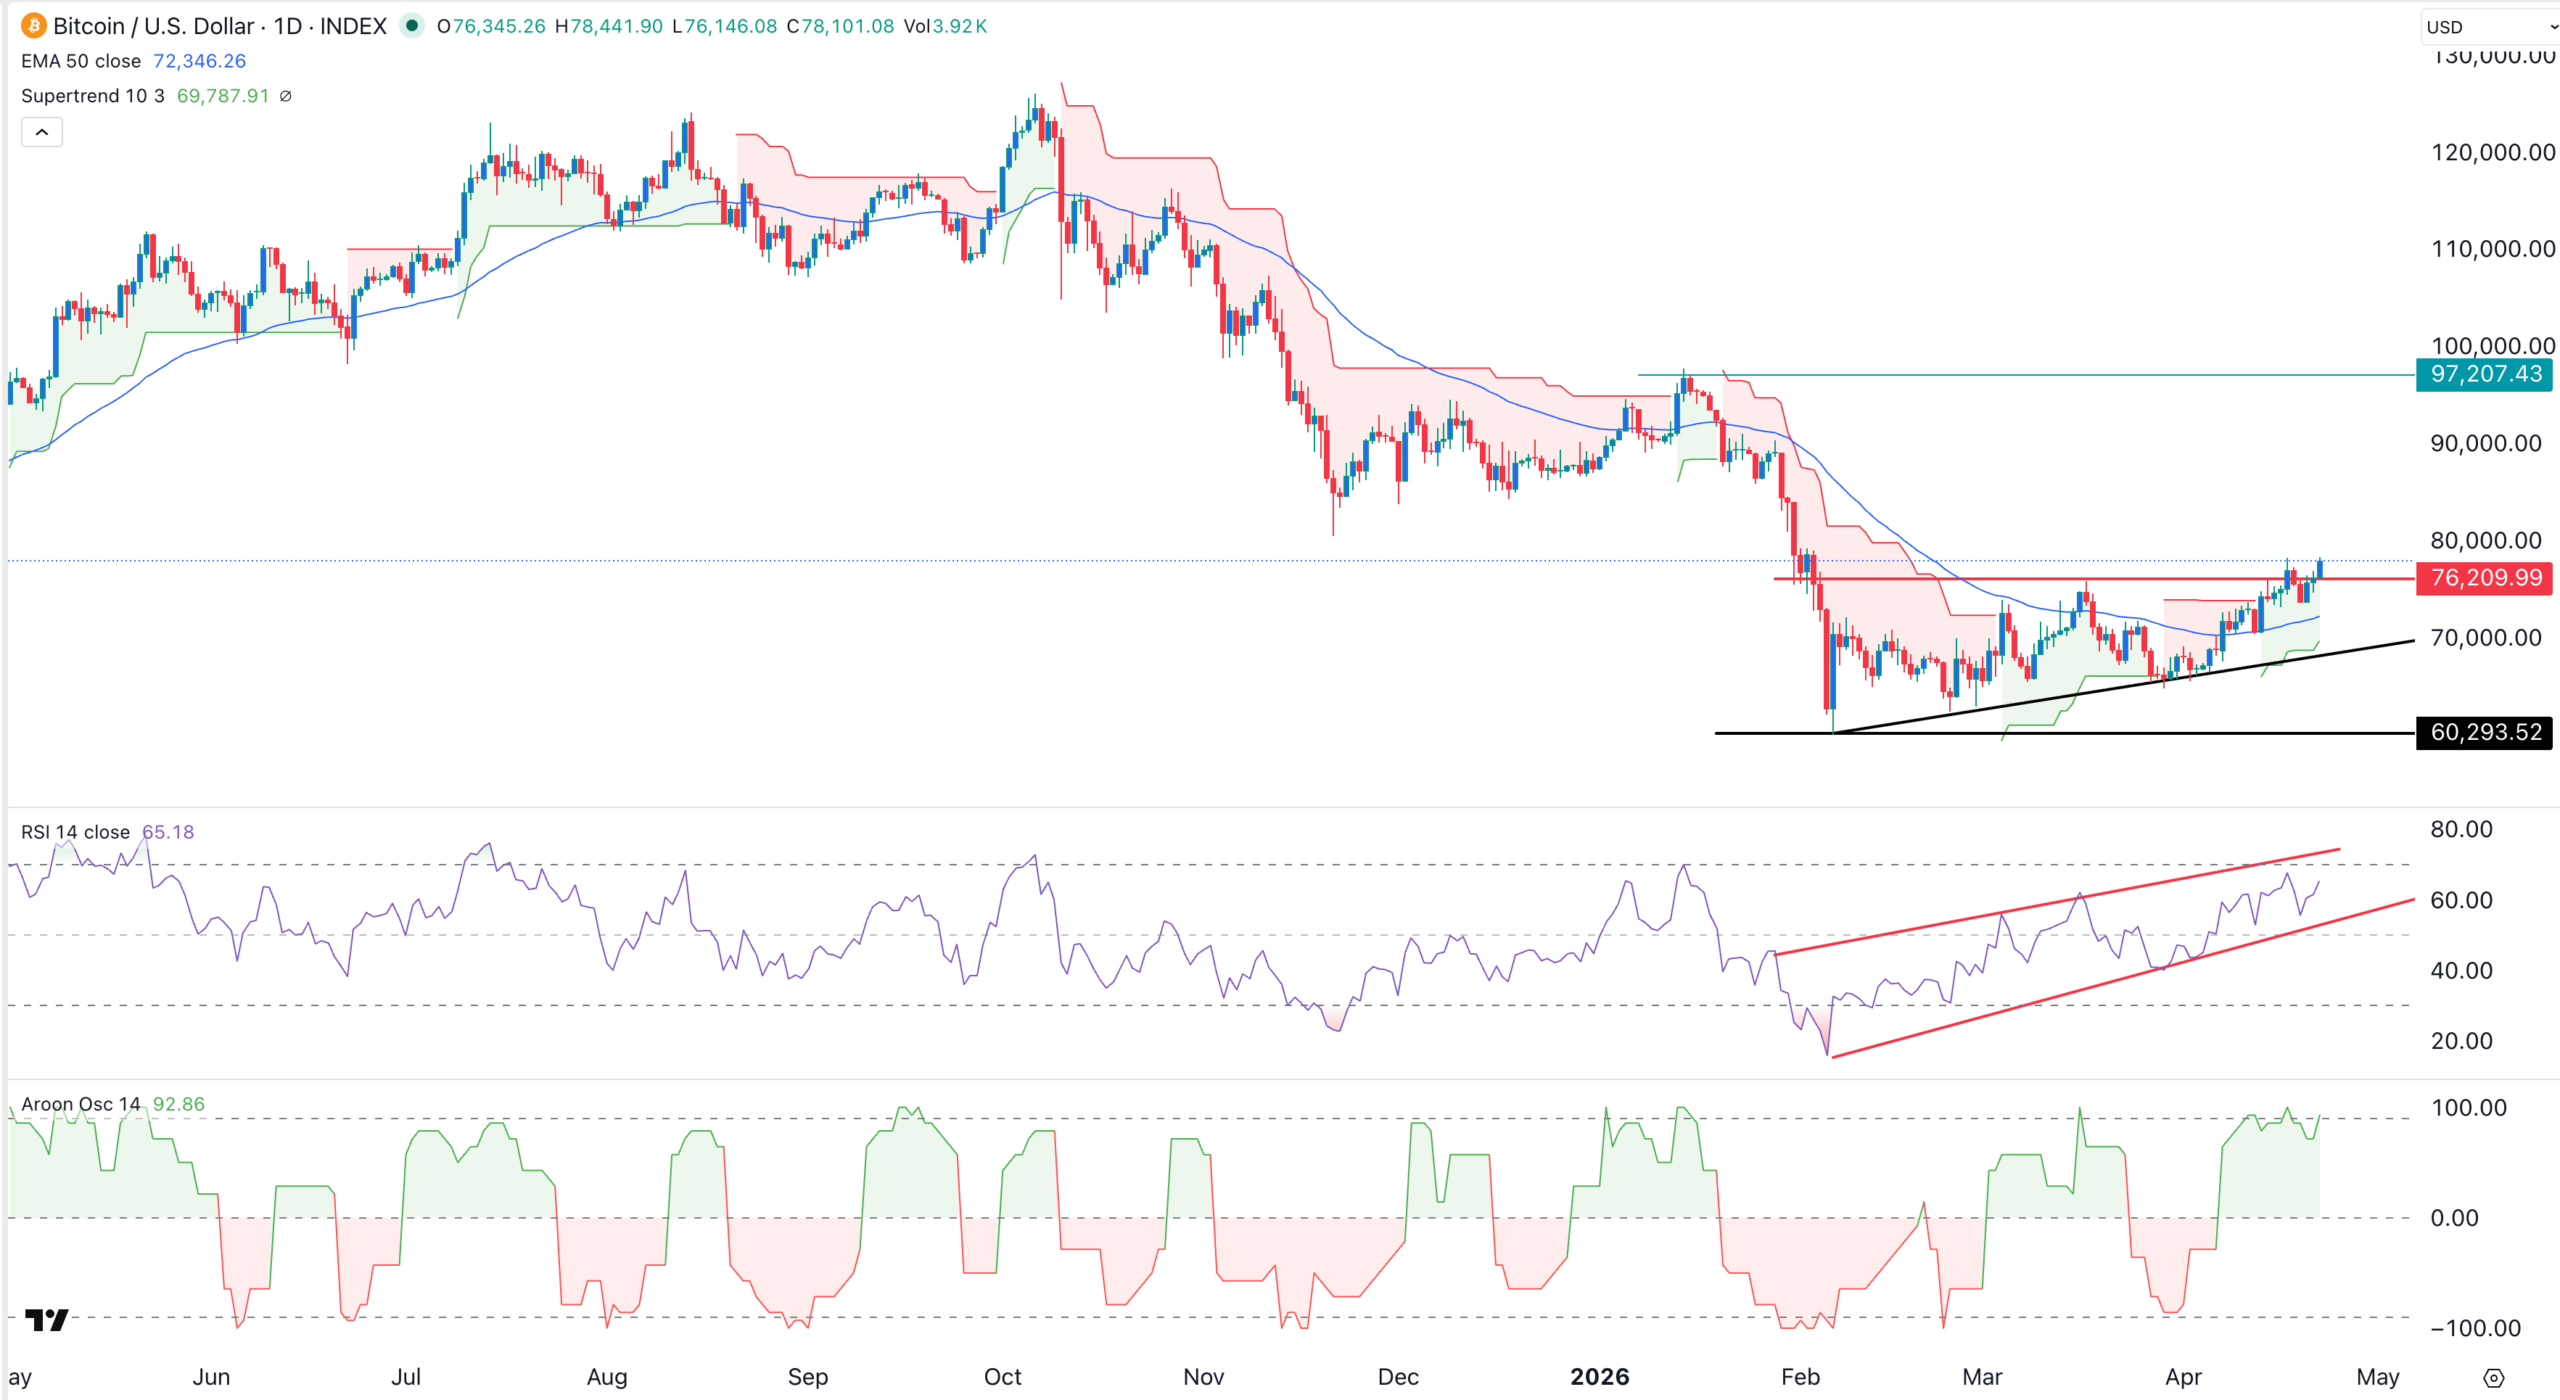
Therefore, the path of least resistance for Bitcoin price remains bullish. Analysts actively target the psychological level of $80,000 as the next key milestone.
A jump above $80,000 will signal more gains for Bitcoin price. Analysts see the next crucial resistance at $97,000, the highest swing from January this year.



