
 Pearl
Pearl Zylo Ecosystem
 Bitway
 Walrus
 Starknet
 Quantus
 Pudgy Penguins
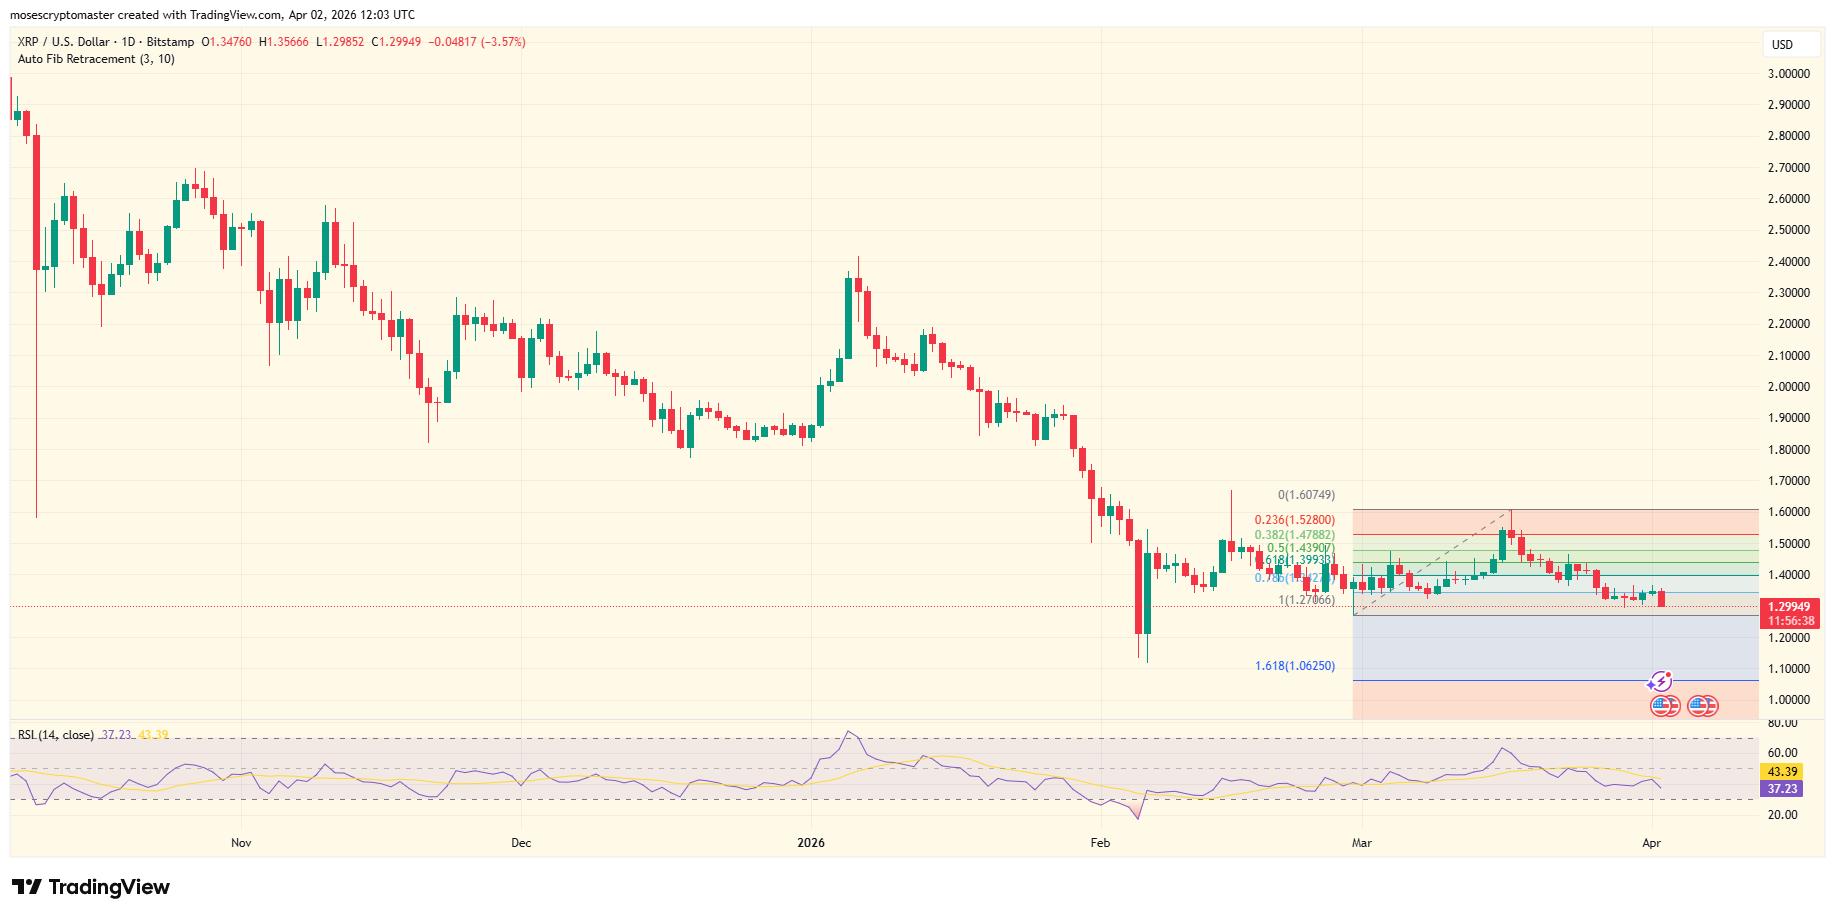
The XRP price traded near $1.30 on April 2, 2026, after failing to reclaim resistance. TradingView data showed sellers defending a dense supply zone between $1.40 and $1.45. This shift occurred because multiple technical barriers converged, limiting upside momentum and keeping price compressed below resistance.
Market pressure built as traders watched the XRP price approach a decisive structure. The move followed weeks of lower highs, which aligned with weakening participation across both spot and derivatives markets. That reaction mirrored declining confidence as broader crypto sentiment softened into early April.
XRP Price Faces Immediate Resistance Pressure
TradingView data showed XRP price struggling under a confluence of resistance indicators. The upper boundary of a symmetrical triangle aligned with the 200-week exponential moving average and the 50-day exponential moving average. This structure formed a tight ceiling that capped bullish attempts during recent sessions.
Glassnode data indicated heavy investor positioning within that same range. The cost-basis distribution heatmap showed more than 1.1 billion XRP accumulated near this cluster. This shift occurred because buyers from prior rallies held underwater positions, which increased sell pressure as price revisited their entry levels.
Attempts to break higher faced resistance from these holders seeking to exit at breakeven. That behavior limited upward continuation despite short-lived intraday rebounds. As a result, the XRP price remained trapped within a narrowing range, with sellers maintaining control near the upper boundary.
XRP Price Structure Weakens Below Triangle Support
TradingView charts showed the XRP price retesting the lower boundary of its symmetrical triangle. The structure tightened as price approached a critical breakdown zone near short-term support. This move followed a steady decline from late March highs, which erased prior recovery attempts.
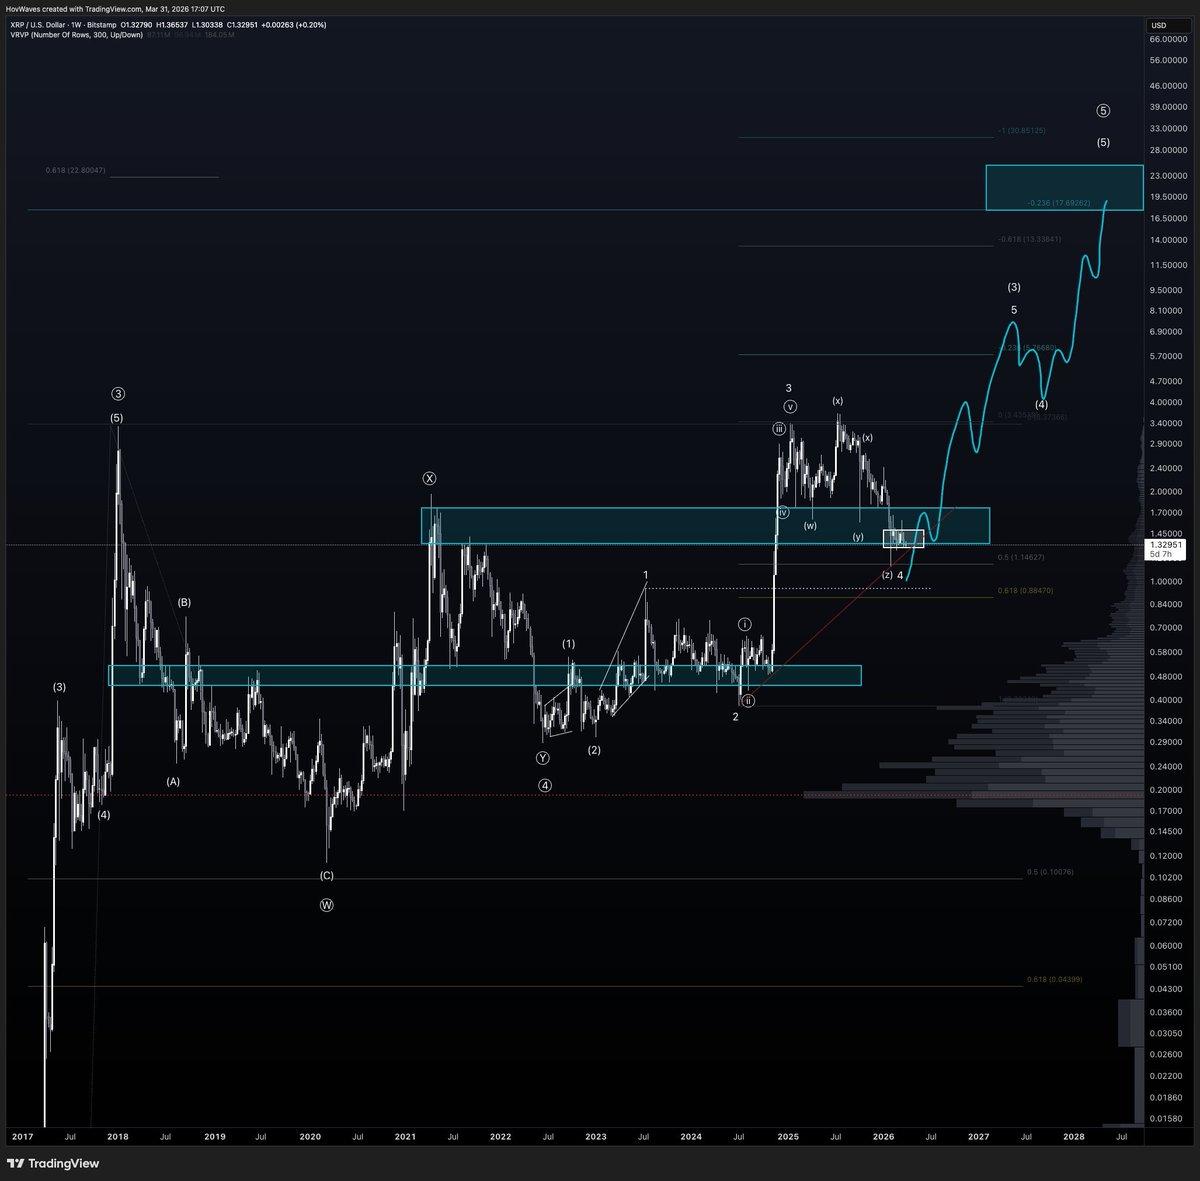
CryptoBasic analysts flagged downside levels at $1.146 and $0.884 in a recent X post. They noted that losing current support would confirm continuation of the broader downtrend. That reaction mirrored historical breakdown patterns, in which compressed structures resolved lower after repeated rejections at resistance.
The broader bullish structure depended on holding above $0.93, which would have invalidated it. If price breached this threshold, the market would likely shift toward extended downside targets. In the near term, traders focused on whether the triangle support would hold or fail under persistent selling pressure.
XRP Price Weakens as Network Activity Declines
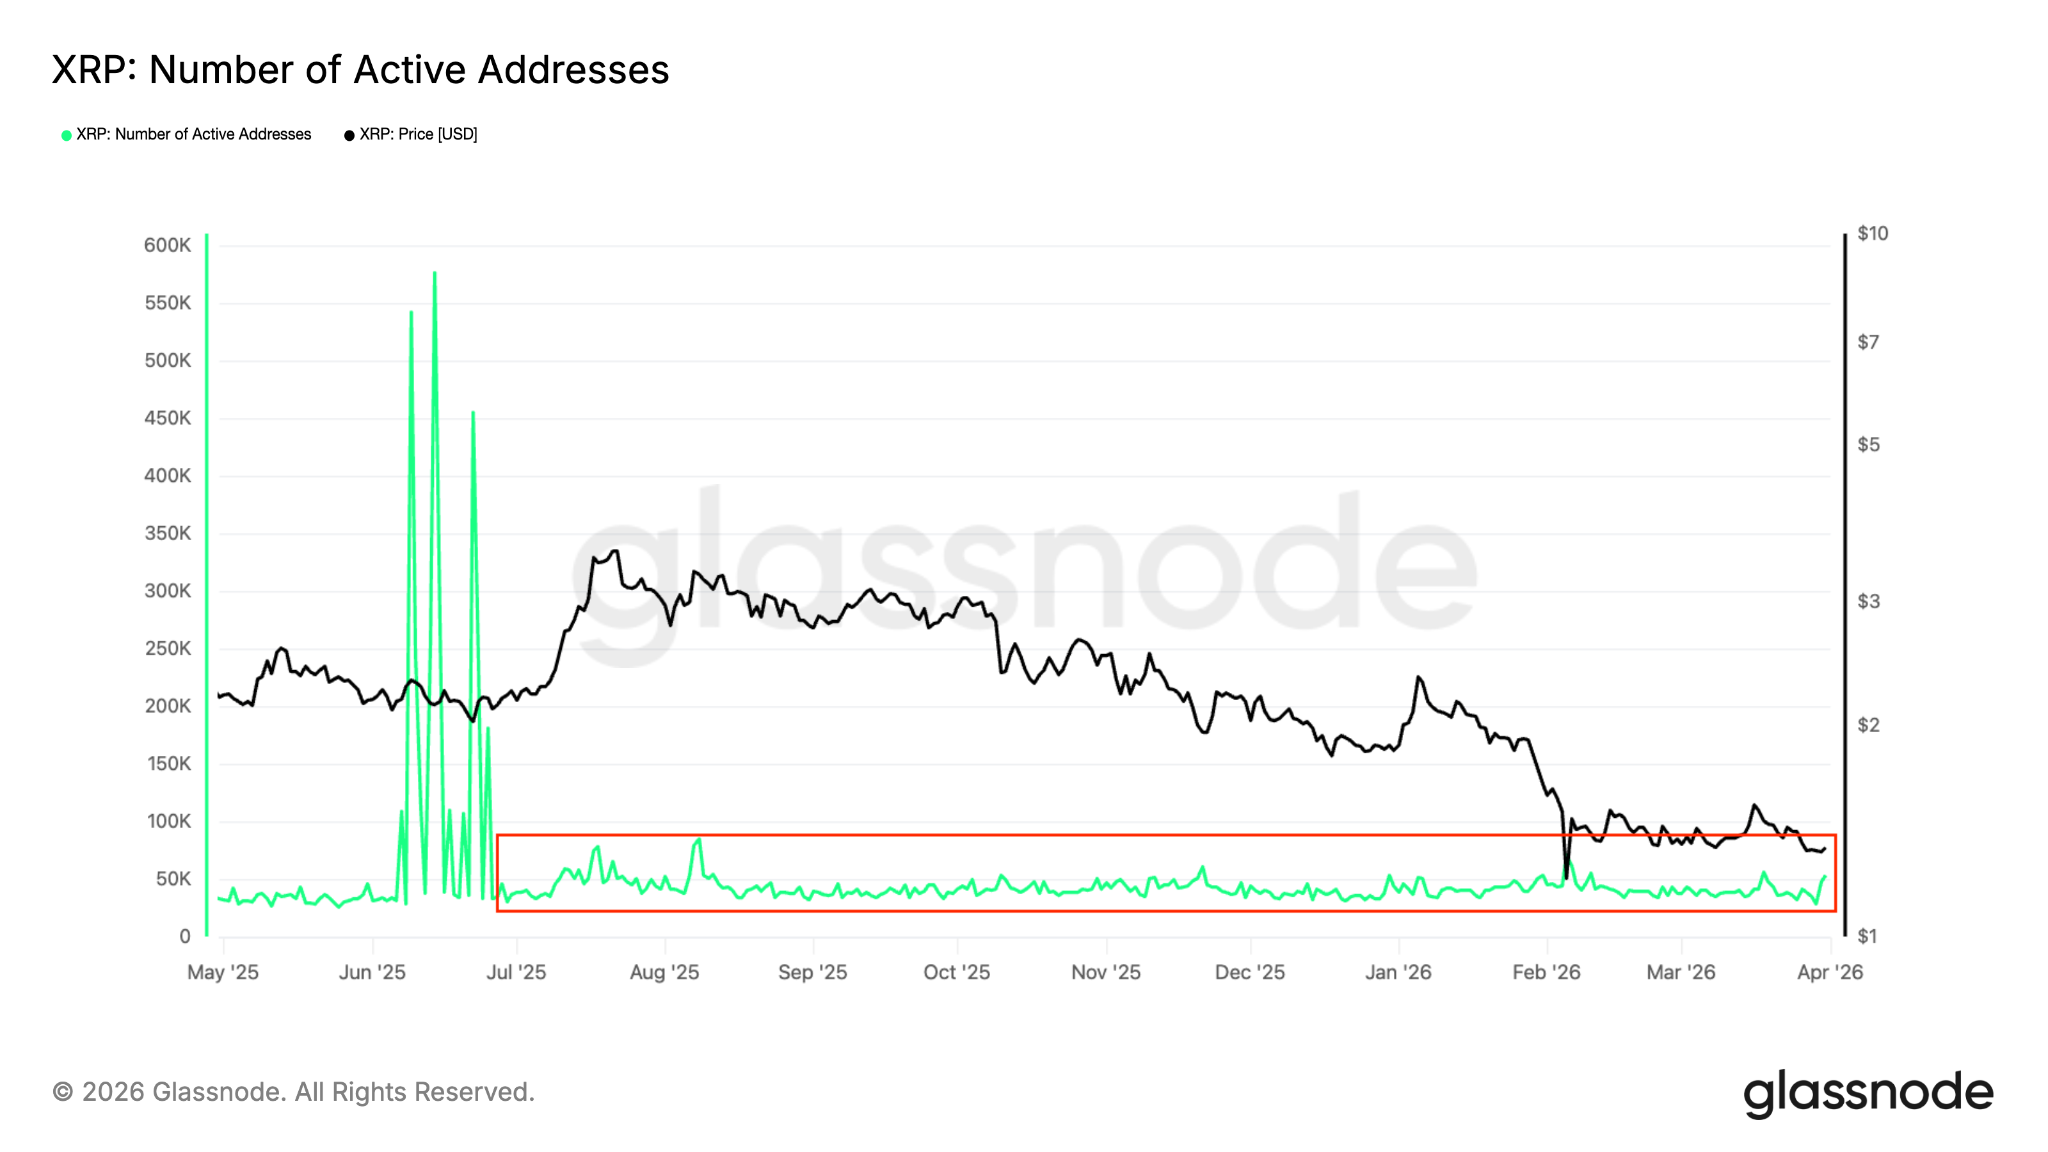
Glassnode data showed a sharp drop in XRP Ledger activity since July 2025. Daily active addresses fell to around 48,000, far below levels recorded in March and June 2025. This shift occurred because user engagement declined, signaling reduced transactional demand across the network.
CryptoQuant data recorded a 44% drop in daily transactions, which fell to 1.5 million. The move followed a peak of 3.4 million transactions recorded on March 21. That reaction mirrored weakening liquidity conditions, where fewer transactions reduced market depth and buying pressure.
Lower activity often coincided with price stagnation or downside continuation. With fewer participants interacting with the network, demand remained limited. This trend reinforced the bearish structure already visible in price action and technical indicators.
XRP Price Pressured by ETF Outflows and Institutional Retreat
SoSoValue data showed that U.S.-based spot XRP exchange-traded funds recorded net outflows during March. The funds lost $28 million, marking their first negative month since launch. This shift occurred because institutional demand weakened alongside falling prices and reduced market participation.
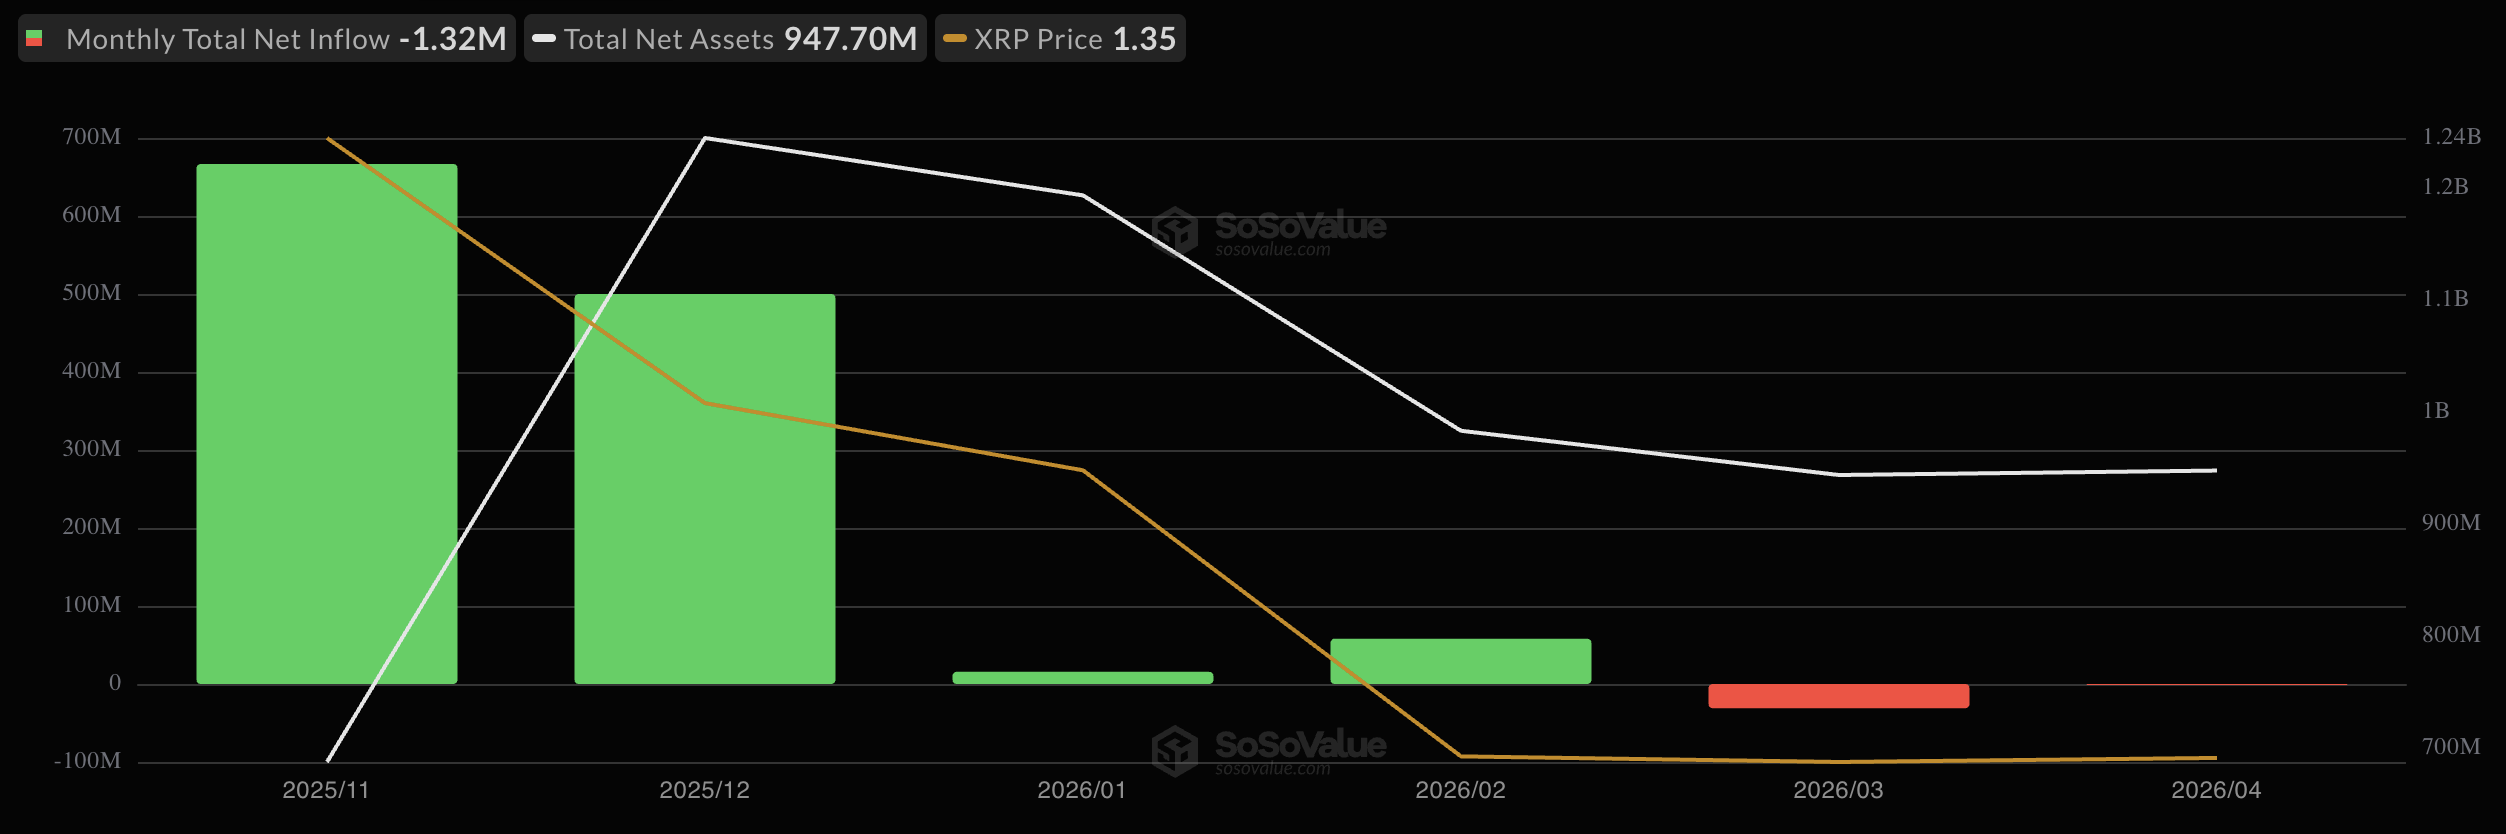
Analyst WizzyOnChain noted that ETF inflows stalled after March 26. That reaction mirrored declining investor confidence, as falling prices discouraged new allocations. The absence of fresh capital inflows reduced support for the XRP price during a critical phase.
Assets under management dropped from $1.24 billion in early January to about $947 million. The decline followed a quarterly price drop exceeding 28%, which weighed on fund performance. As institutional flows reversed, the XRP price faced additional downside pressure from reduced demand.
The XRP price now sits at a decision point near triangle support. A confirmed breakdown could push the asset toward the psychological $1 level, while holding support may delay further downside.



