
 Pearl
Pearl Zylo Ecosystem
 Bitway
 Derive
 Walrus
 Quantus
 Pudgy Penguins

Ethereum price traded near $2,190 on Friday after buyers attempted to defend the $2,150 support zone. ETH remained under pressure after repeated failures near the $2,400 resistance area, while broader crypto weakness and fading momentum continued limiting upside attempts.
Ethereum Price Taps Key Support Zone
Ted Pillows said Ethereum price tapped the $2,150 support zone as expected. According to the analyst, a bounce could follow if buyers defend this area. His chart shows ETH sitting near a green demand zone after failing to hold momentum above the $2,300 region.
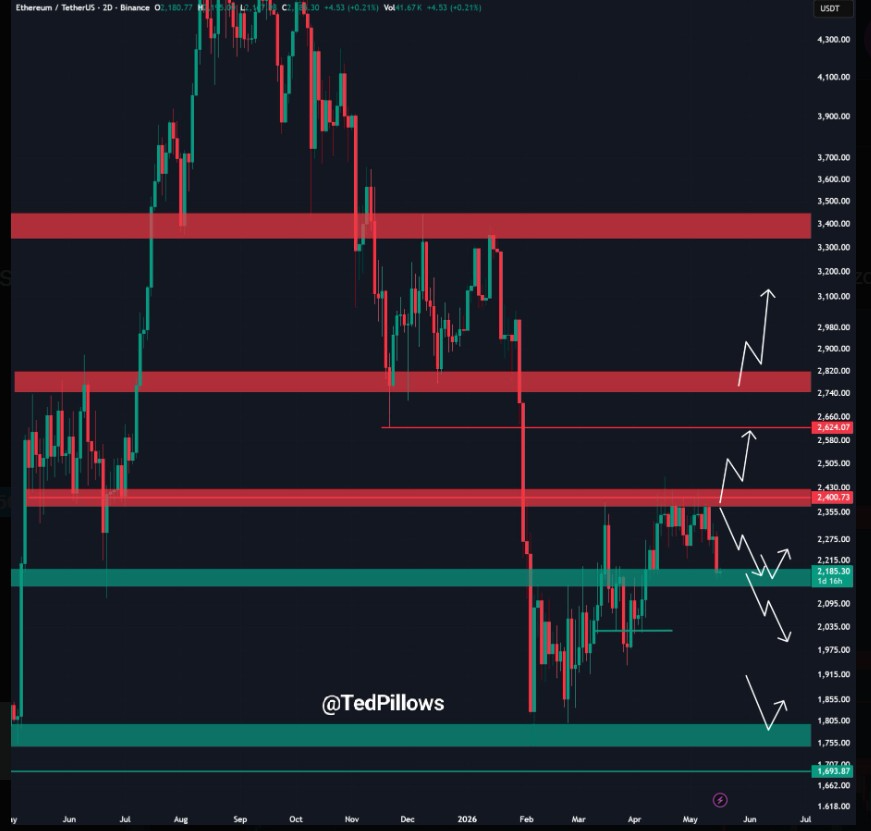
The next major resistance remains near $2,400. A clean reclaim of that level could open the way toward $2,624, then the wider resistance band around $2,740 to $2,820. However, Ethereum price must first recover from the current support area and show stronger follow-through.
If the $2,150 zone fails, the chart points to deeper downside. The next support level sits near $1,800, while a broader bearish continuation could push ETH closer to the $1,700 range. Therefore, the current support reaction may decide whether Ethereum begins a rebound or extends its correction.
Falling Wedge Setup Keeps Bulls Interested
Sangita Lowcap Pump Gems pointed to a falling wedge and said Ethereum’s historical structure may be repeating itself. The analyst compared the current move to a prior setup in which ETH corrected by around 65% before gaining roughly 250%.
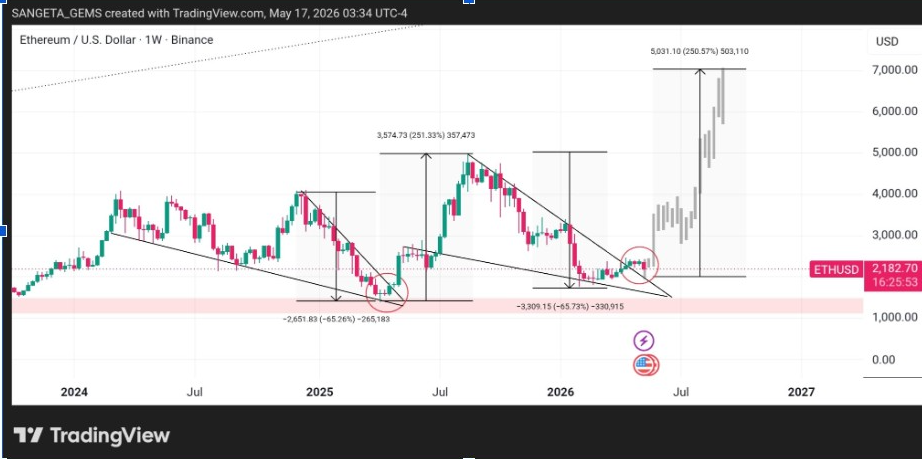
The weekly chart showed Ethereum completing a major pullback and retesting a breakout region. According to the analyst, the psychological breakout and retest are already complete, which could set the stage for a stronger upside move if buyers return.
The chart also projects a possible move toward $7,000 over time. That target remains highly ambitious and would require a broad market rally, stronger liquidity, and a clean break above major resistance. Still, the setup suggests some analysts continue to view the current range as a higher-timeframe accumulation zone.
However, the market has not confirmed that larger bullish path yet. ETH remains below key trend resistance, and short-term structure still shows weakness. Bulls need a decisive move above $2,400 to support the case for a larger trend reversal.
Analyst Watches ETH Crypto Price at $2,270
However, Crypto WZRD said Ethereum and ETHBTC both closed slightly bearish on the daily chart. The analyst noted that ETH is currently trading near the $2,200 support target, while a break below this level could send the price lower toward $1,800.
On the intraday chart, ETH is holding below $2,270. According to the analyst, a retest of that old resistance, followed by a rejection, could set up a short trade toward the $2,100 support area. However, holding above $2,270 would create room for further upside.
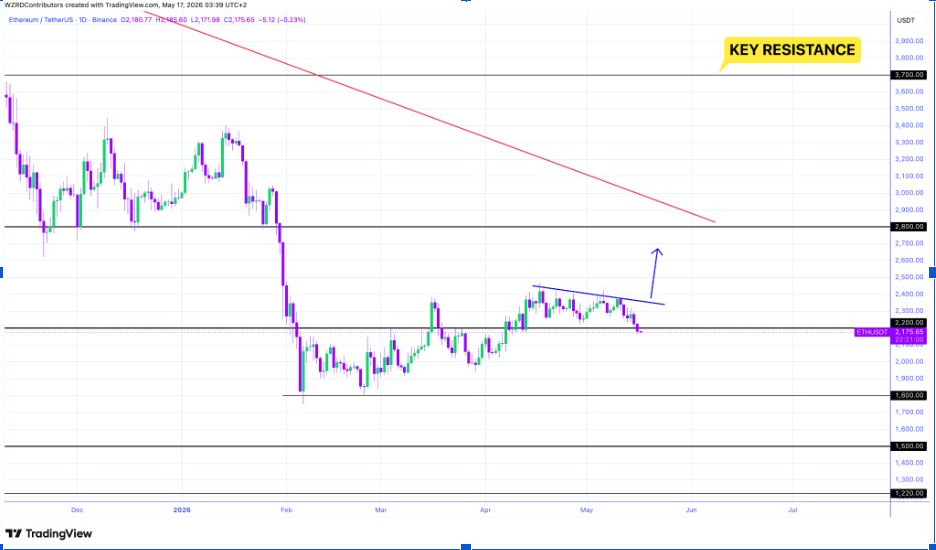
Crypto WZRD also said Ethereum may mirror Bitcoin’s next move, especially if Bitcoin dominance starts to decline. In that case, ETHBTC could strengthen, helping Ethereum push higher. Still, the analyst remains focused on lower-timeframe confirmation before calling the next move.
This makes $2,270 an important short-term level. A reclaim would improve momentum and place $2,400 back in focus. A rejection would keep sellers active and could force another test of $2,150.
Downtrend Resistance Still Blocks ETH Crypto Price
Additionally, Alex Marzell offered a more cautious view. The analyst said Ethereum failed again to break the major downtrend resistance, with the move toward upside liquidity getting rejected. His chart shows ETH crypto price slipping below a descending trendline after another failed attempt to hold higher levels.
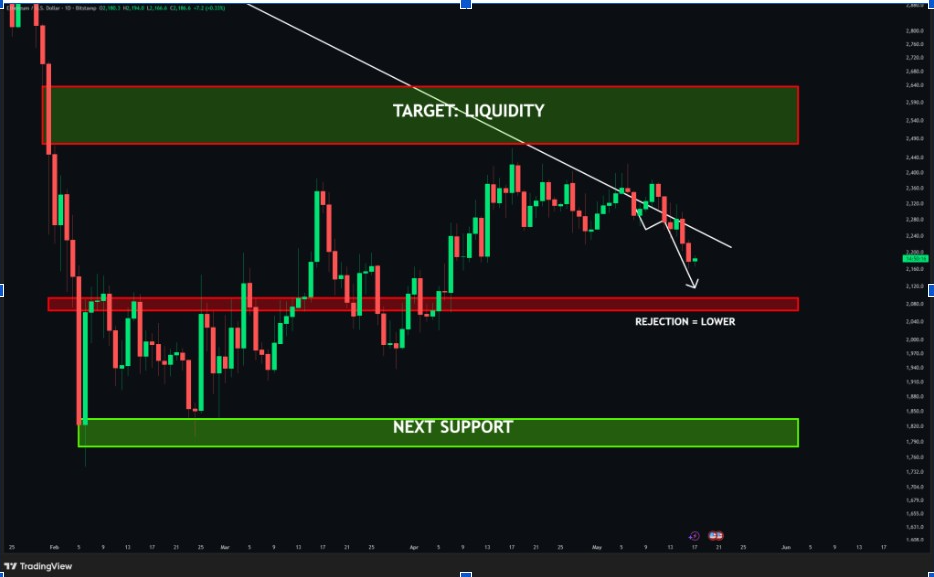
The red support box below remains important. If ETH holds that zone, buyers may still defend the range and attempt another recovery. However, rejection from the same trendline keeps the broader short-term structure under pressure.
The chart marks upside liquidity around the $2,480 to $2,640 zone, but ETH crypto price must first reclaim the broken trendline and recover above $2,270. Without that, the next support area near $1,800 stays relevant.



