Wisp
Wisp Doge Pepe
 Crawlerpad
 Zylo Ecosystem
 Pearl
Pearl Basic Attention
 Quantus

Ethereum price traded near $2,119 after rebounding from the $2,000 support region. However, buyers still face heavy resistance near $2,150, where recent rallies have repeatedly stalled.
Analysts said ETH must reclaim higher levels quickly to maintain bullish momentum. Failure to do so could send the token back toward lower support zones.
Ethereum Price Recovery Stalls Near $2,150
Ted Pillows noted that Ethereum price recovered from the $2,000 support level but failed to reclaim the $2,150 resistance zone. His chart showed ETH crypto reacting from a lower support band before meeting sellers near the same area that has capped recent recovery attempts.
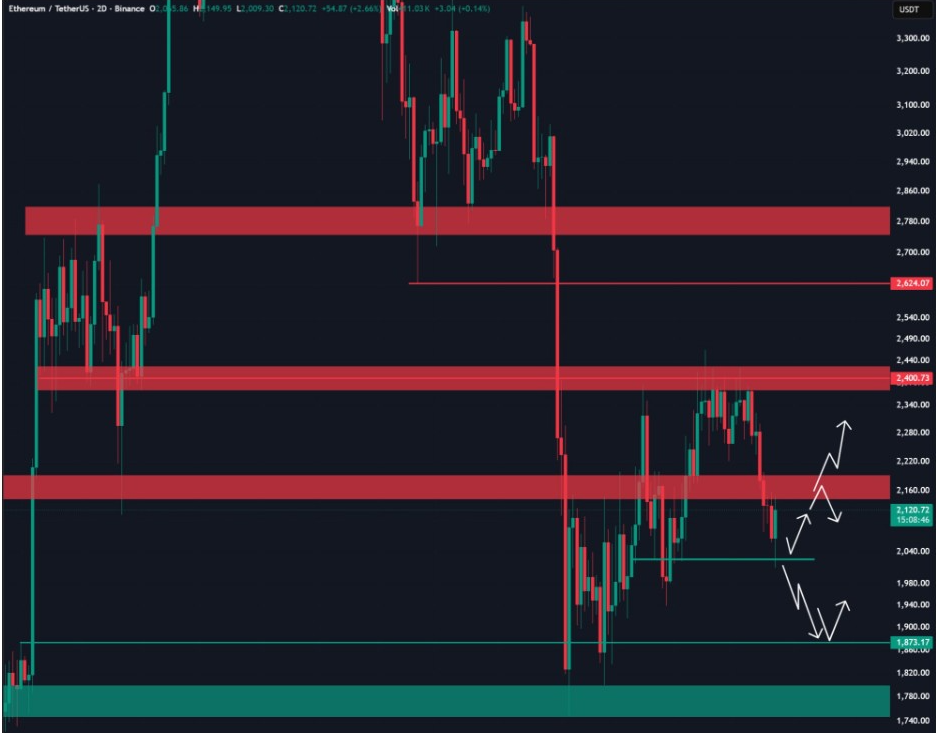
That $2,150 zone now acts as the first key battleground. If Ethereum price flips it back into support, the next move could target $2,250. A stronger continuation above that level would then shift focus toward the broader resistance band near $2,400.
However, the downside path remains open while the top altcoin trades below $2,150. Ted’s chart showed that rejection from this zone could send the price back toward $2,000. If that level breaks, ETH may revisit the lower support area around $1,873 before buyers attempt another defense.
For now, Ethereum price prediction remains tied to this short-term reclaim. A close above $2,150 would show that bulls are regaining control. A weak rejection would keep bears in charge of the immediate structure.
ETH Crypto Weekly Close Above $2,100 Matters
On the higher timeframe, Sky pointed to $2,100 as the level Ethereum price must hold. The weekly chart showed ETH crypto trading near the 0.5 Fibonacci region around $2,100, with higher levels marked near $2,573 and $3,438.
This gives Ethereum price a clear short-term threshold. If ETH closes above $2,100, bulls may build enough momentum to push toward $2,570 next. That would align with Sky’s view that a close above this area could open a stronger recovery.
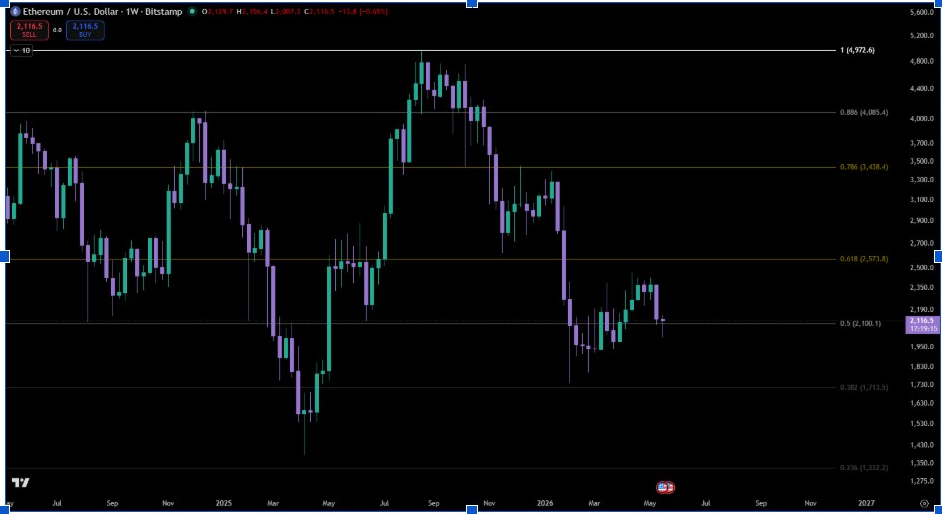
Still, the weekly chart showed Ethereum remains far below its former highs. The broader structure has not fully reversed, and ETH needs more bullish weekly candles to confirm that the current bounce is more than a temporary relief move.
A close below $2,100 would weaken this setup. It would also support the bearish view that ETH is still struggling under major resistance, even after recovering from the $2,000 area.
Analyst Watches $2,200 Breakout
Meanwhile, CryptoWZRD said Ethereum and ETHBTC both closed bullish, which gives bulls a short-term opening. However, the analyst stressed that Ethereum must move above $2,200 to enter a clearer bullish territory.
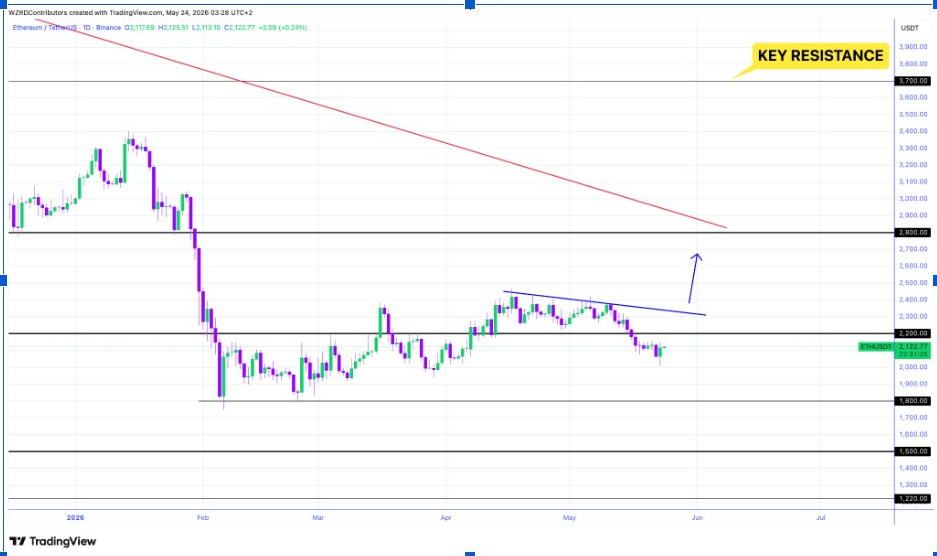
The daily outlook places $2,200 as the next major confirmation level. A rally above that zone could send ETH toward $2,800 or higher, especially if Bitcoin dominance keeps moving lower. Such a move would signal broader capital rotation back into Ethereum.
Intraday, ETH crypto is trading above $2,100 after a volatile session. Holding this level may support further continuation toward the $2,270 resistance. However, a move back below $2,100 would reopen the short side and bring weakness back into focus.
This leaves ETH in a tight but important range. Buyers need to defend $2,100 first, then push the price back above $2,150 and $2,200. Until that happens, the recovery still looks unfinished.
ETH Crypto Liquidation Data Points to Volatility Risk
Additionally, CW noted that high-leverage long and short positions on ETH have both fallen sharply. That means the market has fewer large leveraged positions waiting to be wiped out. Even so, thinner leverage can still make price action jumpy when momentum shifts.
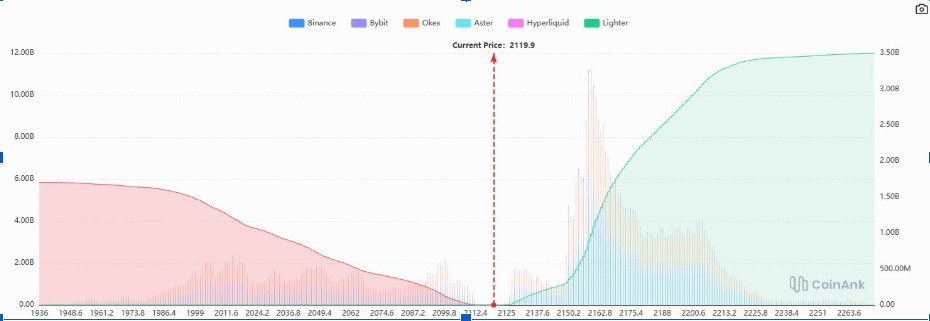
The liquidation map showed a large concentration of short positions sitting above the current market price near $2,119. According to the analysis, even a modest breakout above resistance could trigger forced short liquidations and accelerate upside momentum. That setup increases the probability of sharp price swings around the $2,150 region.
At the same time, failed breakout attempts may quickly reverse sentiment and place both $2,100 and $2,000 back under pressure.