Identity.md 6900
 Crawlerpad
 Claudia
 Bunker Mode
 Quantus
 Starknet
 Bitcoin

Dogecoin price traded near $0.10 as the token approached a support area that has influenced price action since March.
The current setup has attracted attention because multiple analysts identified the same region as an important technical level. While some charts point to recovery scenarios, others suggest the broader correction may not be complete.
Dogecoin Price Holds Near Trendline Support
Dogecoin price is sitting near a rising support trendline that has guided its recovery attempts since March. Trader Tardigrade noted that DOGE crypto has repeatedly bounced from this line, with each touch followed by a stronger upside move.
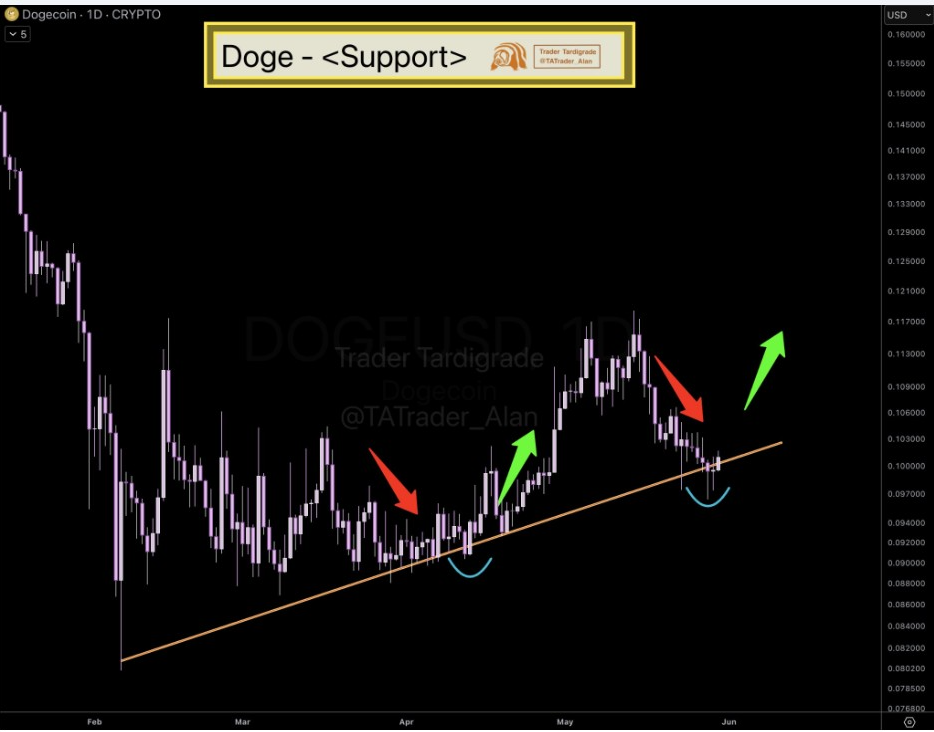
The daily chart showed DOGE holding near $0.10 after pulling back from its May high. The support trendline now sits just below the current price area, making this level important for short-term direction.
If DOGE crypto holds this support, the pattern would remain intact. A rebound could push the price back toward the $0.106 to $0.110 region first. A stronger move may then open the way toward $0.12, where recent resistance has limited upside momentum.
However, a clear breakdown below the trendline would weaken the structure. In that case, DOGE could lose the bullish setup and revisit lower support near $0.09.
DOGE Crypto Analysts Watch 50% Rally Setup
Meanwhile, World Of Charts said Dogecoin price is retesting a trendline and horizontal support zone at the same time. The analyst expects a successful retest to support a bullish wave in the coming days.
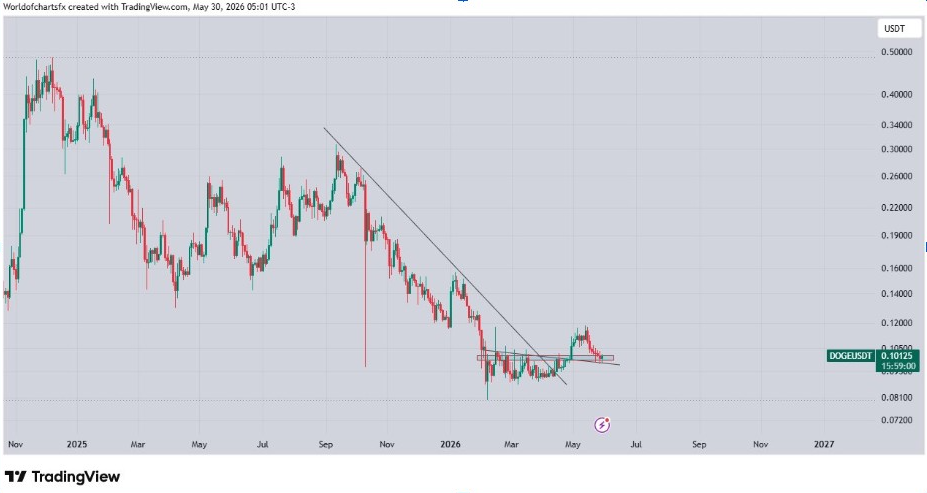
The chart showed the top memecoin after a long decline from late 2025 highs. Price has already broken above a descending resistance line, then returned to test the breakout area. This type of retest often decides whether a breakout has real strength or fades back into the prior range.
A confirmed bounce from the current zone could support a larger recovery. World of Charts suggested that a successful retest may lead to a 50% bullish wave. From DOGE’s current area near $0.10, that would place the next larger upside target near $0.15.
Still, DOGE crypto must first reclaim short-term resistance near $0.12. Another chart from Jaz also shows a possible route toward $0.20, but only after DOGE clears the $0.12 region and turns it into support.
Short-Term Chart Points Dogecoin Price to $0.20
At the same time, Jaz shared a 4-hour chart showing Dogecoin price building a base around $0.10. The projection shows price rising toward the $0.12 resistance zone, retesting it, and then extending toward the $0.20 to $0.21 region.
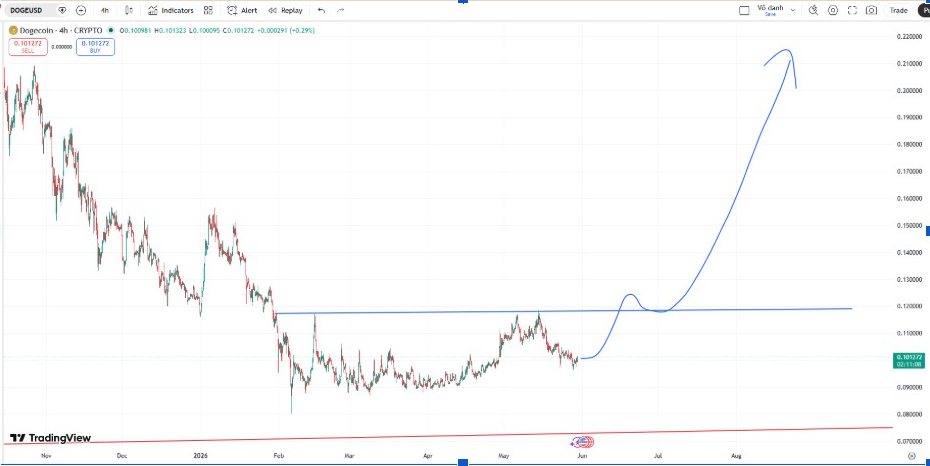
That move remains speculative for now. DOGE first needs to defend the current support area and build volume on any breakout attempt. Without stronger demand, the token may continue moving sideways between $0.09 and $0.12.
Still, the setup gives traders a clear range. The $0.10 level is the immediate floor. The $0.12 zone is the first major test. A close above that area would make the bullish case stronger and could invite momentum buyers back into the market.
For now, Dogecoin’s near-term outlook depends on whether buyers can hold the rising support line. If they do, the market may attempt another leg higher. If they fail, the recent rebound could turn into another lower-high setup.
Elliott Wave View Warns Of Deeper DOGE Crypto Risk
However, not every analyst sees the current area as a final bottom. Alex took a wider view using the monthly and weekly Elliott Wave structure. His analysis suggests DOGE crypto may still be inside the final Wave C of a larger ABC correction.
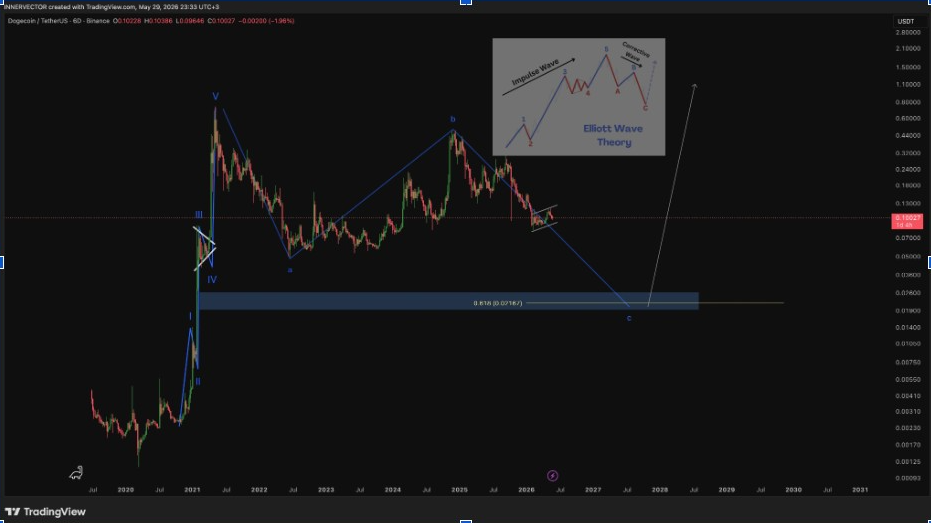
In that analysis, Dogecoin price finished a five-wave impulse during the 2020–2021 cycle. After that rally, the market shifted into a correction. Wave A carried the first major drop, Wave B brought a recovery, and Wave C may still be unfolding.
The analyst noted that the low of Wave A has not yet been broken. Historically, final Wave C moves often take out the prior low before a long-term base forms. His chart placed the 0.618 Fibonacci retracement zone near $0.02 to $0.03 as a possible final capitulation area.
On shorter timeframes, DOGE price is trying to hold the $0.10 area and build a rebound. However, the longer-term Elliott Wave count still warns that another deeper leg lower remains possible if broader market conditions weaken.