
 Pearl
Pearl Bitway
 Pudgy Penguins
 Quantus
 Walrus
 Quant
Quant Artificial Superintelligence Alliance

Chainlink price is back at a decision point after LINK slipped toward the lower edge of its short-term channel. The token trades near $9.09, where buyers have previously stepped in during pullbacks. This area now carries extra weight, as several charts show the same support band acting as the first line of defense before a possible recovery attempt.
Market watchers are split on the next move. Some see a rebound setup toward $10.10 and $11 if LINK crypto holds the channel bottom. Others warn that a drop below $8.95 could weaken the structure and delay any upside attempt.
Chainlink Price Holds Near Channel Floor
Ali Charts shared a daily Chainlink chart showing price testing the lower boundary of an ascending channel. The setup has produced earlier rebounds since April, and the latest reaction puts buyers under pressure again. LINK crypto needs to defend the $9 area to keep the current recovery structure intact.
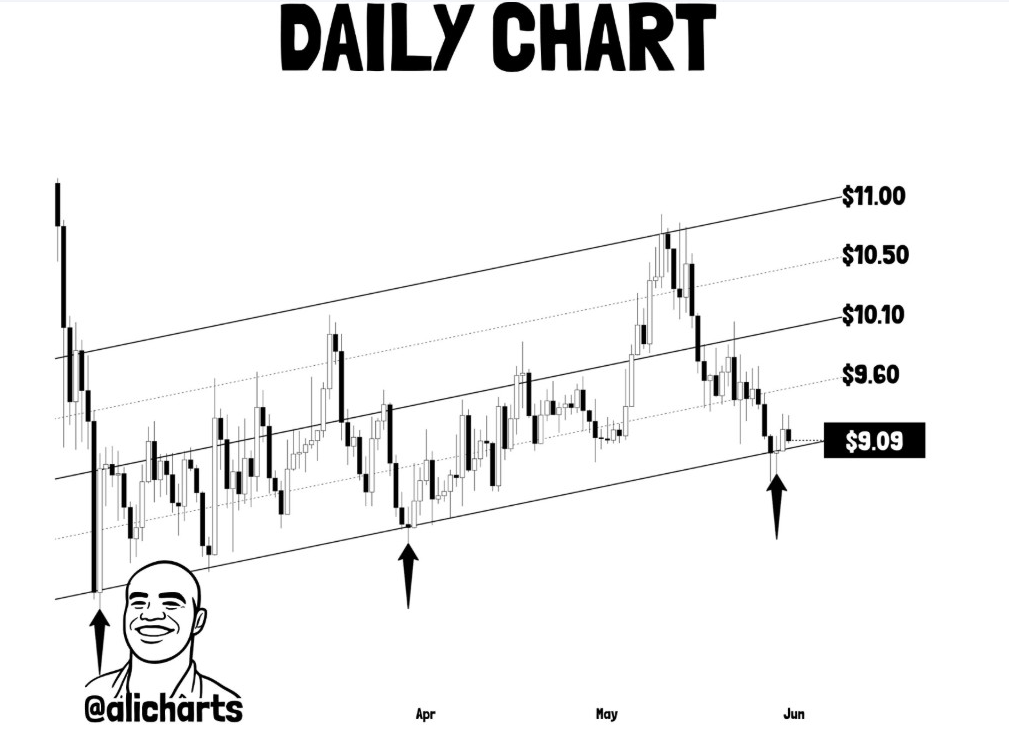
The chart marks $10.10 as the first upside target if buyers regain control. Above that, $11 becomes the next major level. Those levels sit around the middle-to-upper section of the channel, where sellers could step back in if momentum weakens.
Still, the latest pullback shows buyers have not taken full control yet. Chainlink price has slipped from the channel’s upper range and is now trading near support. A strong bounce from this area could restore confidence, while a weak reaction may expose LINK to another move toward lower levels.
LINK Crypto Short-Term Breakout Needs Follow-Through
World of Charts also pointed to a short-term breakout from recent consolidation. That chart showed LINK price pushing above a compressed range near $9.25, with a projected move toward $11 if the retest succeeds. This adds another bullish layer to the broader setup.
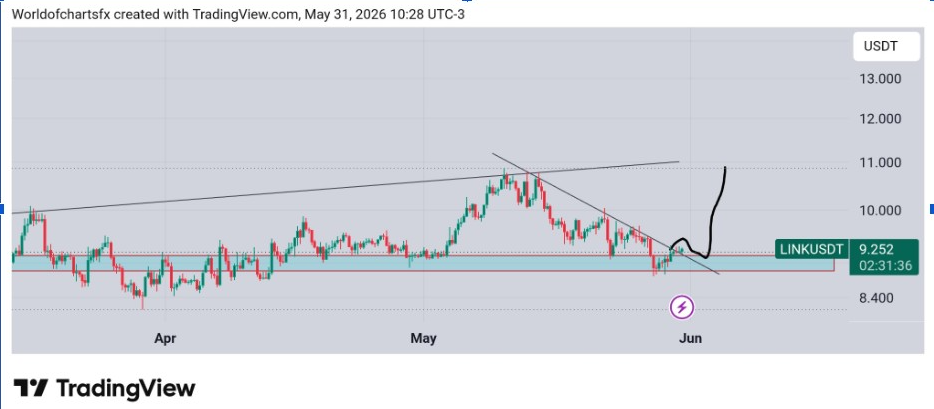
Even so, the breakout still needs confirmation. LINK crypto must hold the reclaimed zone and push above nearby resistance to prove that buyers are not only defending support but also forcing sellers back. A move above $9.65 would strengthen that case.
Meanwhile, failure near this region could turn the breakout into another trap. Chainlink price has spent weeks moving sideways after sharp swings in May, so traders may wait for stronger volume before treating the latest move as a confirmed trend shift.
Chainlink Price Prediction: $8.95 Stands As Key Risk Level
CryptoWZRD’s technical outlook showed a more cautious picture. The report said LINK and LINKBTC closed indecisively, while the weekly and monthly candles also lacked clear direction. That means broader market control has not fully shifted to bulls.
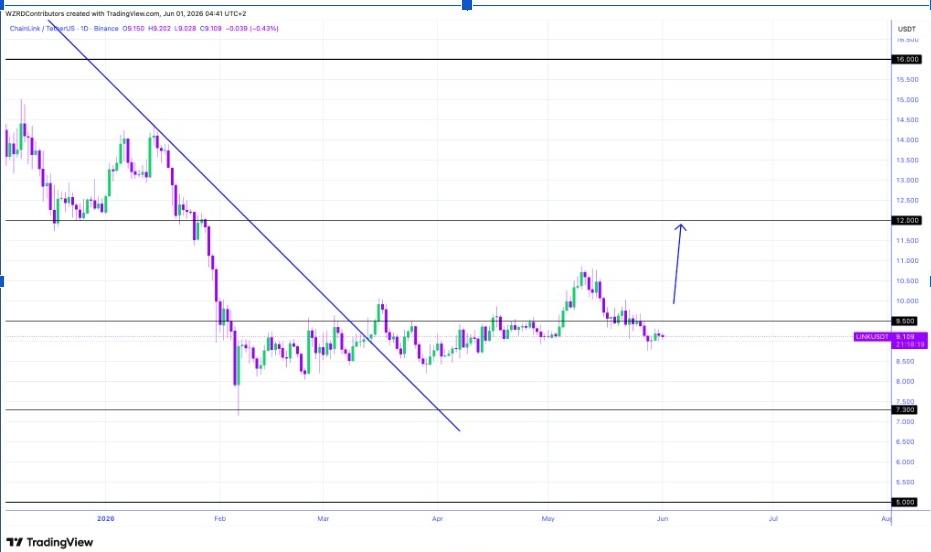
According to the outlook, Chainlink price traded near the $9.50 support territory. Holding above $9.65 could give buyers space for a long setup. However, a break below $8.95 would point to more downside risk. This leaves LINK trading inside a tight range, where even a small move could decide the next larger swing.
The downside level matters as it sits below the current support shelf. If LINK crypto falls to $8.95, sellers could target deeper levels within the range. That would weaken the short-term breakout and make the $10.10 and $11 targets harder to reach in the near term.
Weekly Setup Keeps Bigger Resistance In View
On the higher timeframe, More Crypto Online described the current bounce as wave four in an Elliott Wave scenario. The weekly chart places resistance between $11.94 and $16.46. A decisive break above that band would give bulls a stronger argument for a broader reversal.
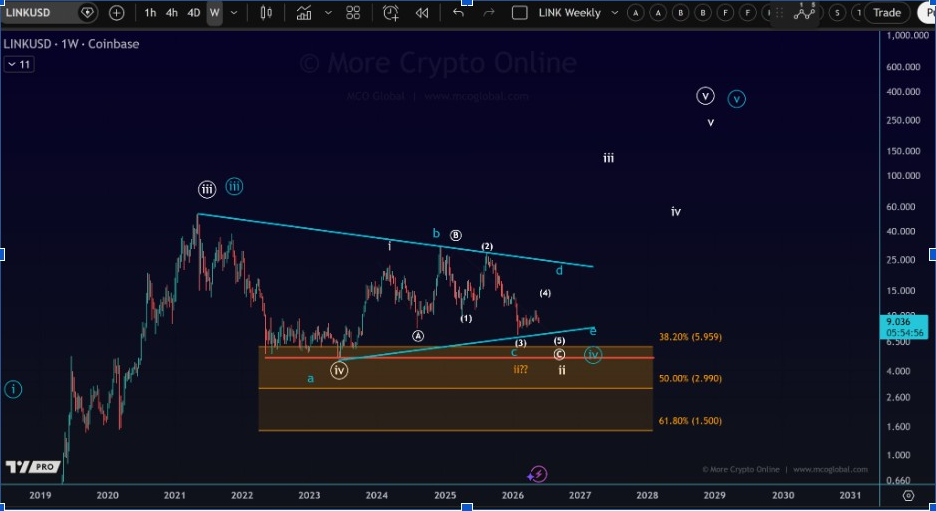
However, the same analysis keeps a triangle scenario active while LINK crypto trades below the higher resistance. The structure suggests that Chainlink may still need more time before a major trend decision forms. For now, the lower-timeframe levels carry greater immediate importance.
Chainlink’s next move now depends on whether buyers can defend the $8.95 to $9.65 area. A firm hold could send LINK toward $10.10 and $11.00. A breakdown below that band would shift attention back to weaker lower-range trading for now.


