
 Pearl
Pearl Bitway
 Pudgy Penguins
 Quantus
 Walrus
 Quant
Quant Artificial Superintelligence Alliance

Bitcoin price is flashing one of those rare setups that traders do not ignore for long. A weekly RSI divergence has appeared again, and the last similar signal came before a massive multi-month rally.
Bitcoin still needs to reclaim the short-term battlefield. Price has struggled around $65,000, liquidity sits higher, and bulls need a clean daily close to turn this setup from interesting into serious.
Bitcoin Price Watches Weekly RSI Signal
Bitcoin price is trading near the $64,000 area after a sharp rebound from its recent July low. The weekly chart shared by Ali Charts shows BTC hovering close to $63,844 while the RSI forms a rising structure near the lower band.
Ali Martinez noted that the previous weekly bullish RSI divergence preceded a rally of more than 700%. While historical patterns do not guarantee similar outcomes, traders often monitor bullish divergences for signs of weakening downside momentum.
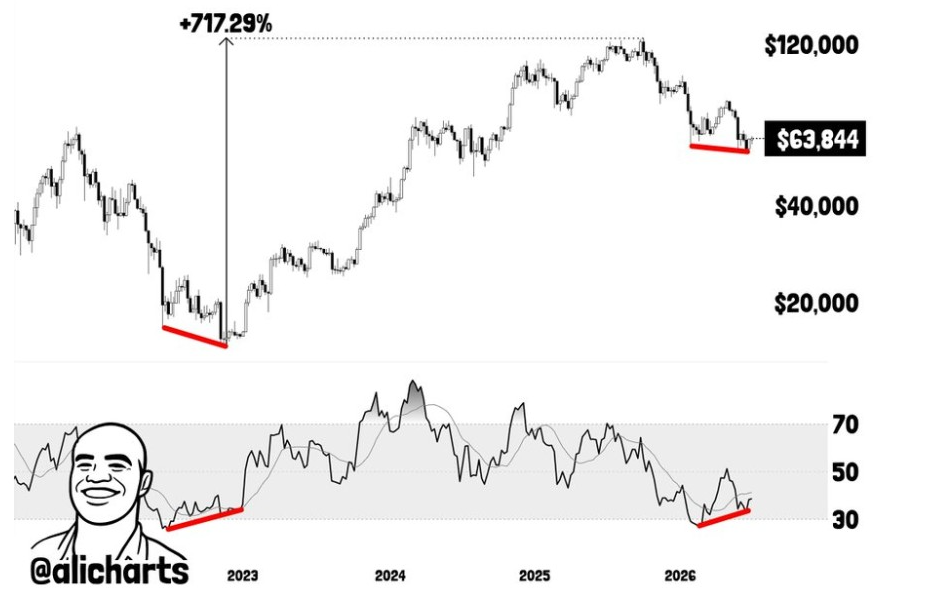
The signal does not confirm an instant rally. It only shows that downside momentum may be fading while buyers start defending lower levels. That kind of setup often becomes important when price also starts reclaiming resistance.
For now, Bitcoin needs a stronger follow-through above $65,000. Without that move, the weekly divergence may stay a warning sign rather than a confirmed bullish reversal.
BTC Crypto Breakout Zone Near $67K Comes Into Focus
Meanwhile, on-chain analyst Daan Crypto Trades said Bitcoin price must hold the green zone to keep bullish momentum alive. His 4-hour chart places BTC near $64,630, with the weekly 200MA sitting around $63,066.
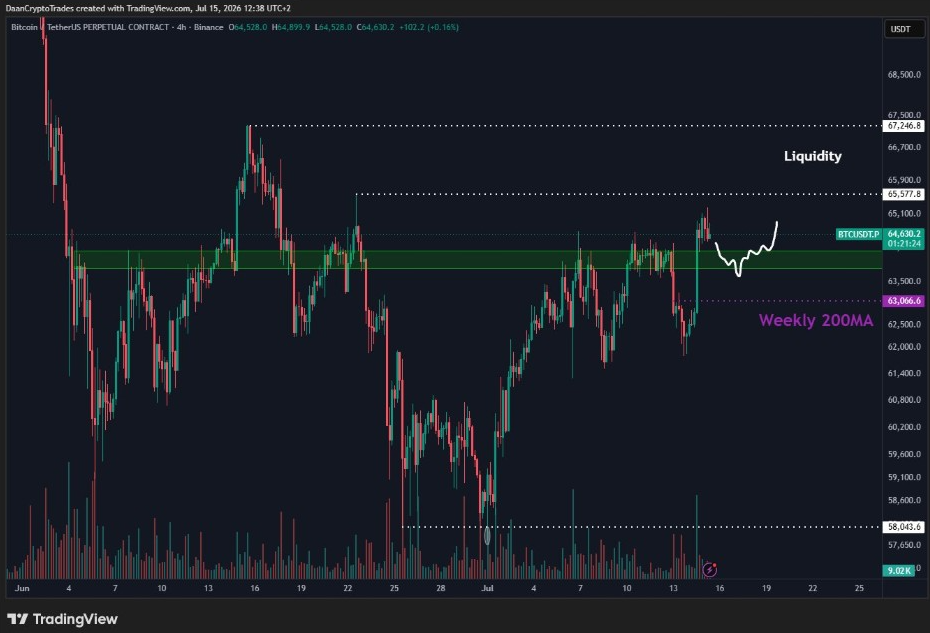
He identified liquidity above $65,600 and a more important level around $67,200. A break above the latter could trigger a larger move and push Bitcoin back toward the middle of its wider $60,000–$80,000 range.
That setup gives traders a clean map. Holding the $63,000–$64,000 area protects the rebound. Reclaiming $65,600 would open the first liquidity pocket. Breaking $67,200 would shift momentum toward the upper range.
If BTC price loses the green zone, the market may retest lower demand before another breakout attempt. That would weaken the short-term recovery but not fully erase the weekly RSI signal.
What BTC Price Holding at $65K Means
Notably, crypto trader Ted said Bitcoin tried to hold above $65,000 but failed. His chart shows BTC rejecting that zone, then drifting back toward nearby support as buyers attempt to rebuild momentum.
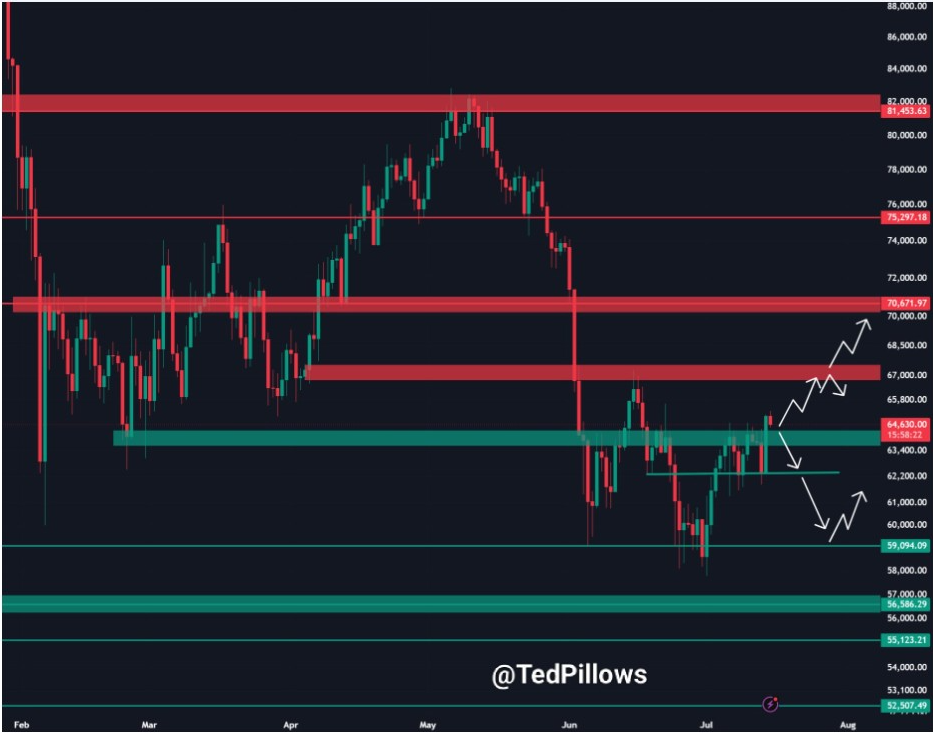
He added that a daily close above $65,000 could quickly push Bitcoin toward $67,500–$68,000. That area aligns with the liquidity and resistance zones identified by other analysts.
The chart also marks lower support zones below the current price. That means bulls need to avoid another failed reclaim, as repeated rejection near $65,000 could invite sellers back into the market.
This article is for informational purposes only and should not be considered financial or investment advice. Cryptocurrency markets remain highly volatile, and technical analysis does not guarantee future price movements. Readers should conduct their own research and assess their financial circumstances before making investment decisions.
Bitcoin Price Prediction: Bull Flag Setup Keeps Bulls Interested
Separately, analyst Don highlighted a possible Bitcoin bull flag formation. His chart showed BTC compressing within a tightening structure after the recent rebound, with price approaching the upper boundary.
A bull flag often forms when price pauses after a strong move, then coils before the next breakout attempt. In this case, the pattern needs confirmation above resistance before traders can treat it as active.
His chart points toward a potential move near $68,666 if buyers break the structure. That target closely matches Ted’s $67,500–$68,000 range and Daan’s $67,200 breakout level.
Bitcoin price holding above the weekly 200 MA keeps the base alive. A daily close above $65,000 improves momentum, and a breakthrough of $67,200 would give bulls the confirmation they need.


