Wisp
Wisp Pearl
Pearl Doge Pepe
 Zylo Ecosystem
 Bunker Mode
 NEAR Protocol
 Crawlerpad

Solana price has returned to a crucial support area after sellers pushed SOL below the $75 region. The decline places the recent recovery structure at risk as price tests the lower boundary of its July trading range.
Analysts now see $72–$74 as the immediate decision zone. A strong bounce could send SOL price toward $80, while a daily breakdown would expose $67.63 and the wider demand region near $60.
Solana Price Tests $72–$74 Reversal Zone
Solana price trades near $73.30 after falling from the $76–$77 region. BitGuru identified the current area as a reversal zone where buyers previously stepped in during late June and earlier July pullbacks.
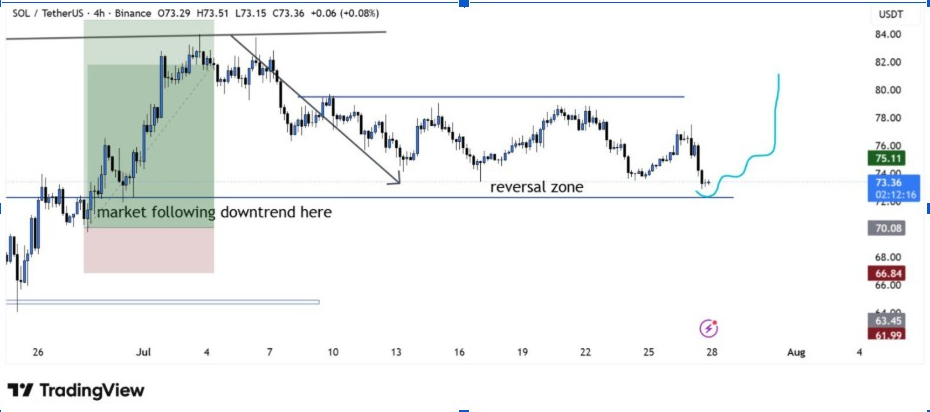
The four-hour chart showed Solana repeatedly holding the horizontal boundary near $72.50. Price rebounded sharply from the same region before climbing toward $82 during the first week of July.
BitGuru expects a successful defense to support another move toward the $75–$76 area. Stronger buying pressure could then allow SOL crypto to challenge the main horizontal resistance around $79.50.
However, buyers still need to produce a clear reaction from support. Weak consolidation near $73 would leave the zone vulnerable, while a close below $72 could shift attention toward $70.08 and $66.84.
SOL Crypto Loses Short-Term Range Support
Meanwhile, top trader Daan Crypto Trades noted that Solana price is beginning to lose its local horizontal support area. The daily chart places SOL below the green zone extending around $75.50 to $77.
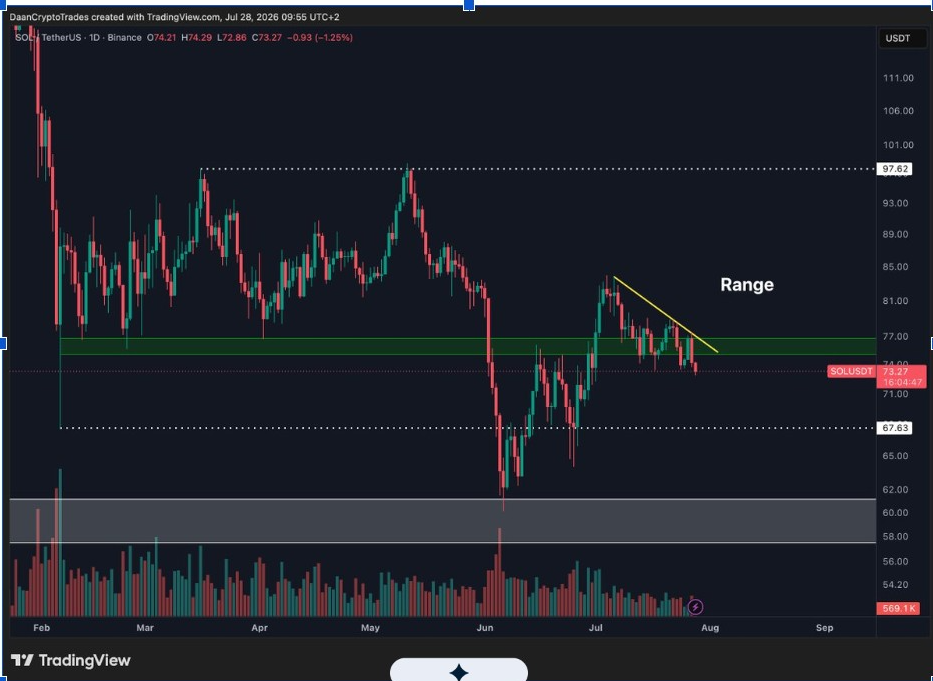
Price has also formed lower highs beneath a short descending trendline. This creates a compressed bearish structure, with sellers defending each recovery attempt while support continues to weaken.
SOL price must break the local consolidation and move above the descending resistance before traders can focus on the range high. The wider chart places that upper boundary near $97.62, well above the current market price.
Failure to reclaim the green zone would keep $67.63 in focus as the lower range boundary. Below that level, a broader demand area between roughly $58 and $61 could become the next defensive region.
SOL Long-Term Trendline Caps Recovery
Additionally, Lucky’s daily chart showed SOL trading directly beneath a long-term descending trendline. That barrier has guided the broader decline from the previous high near $253.44.
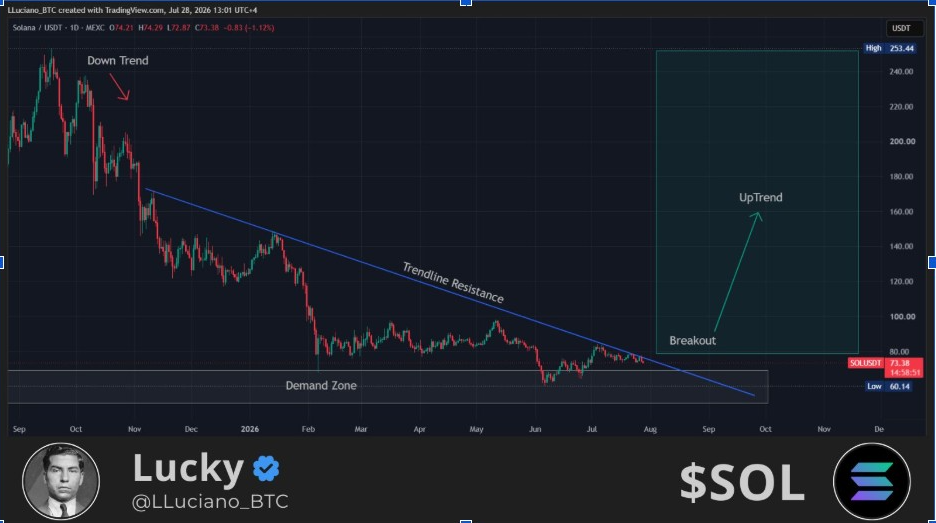
Solana price has spent several months forming a base above the wider $60–$70 demand zone. Price briefly recovered toward $84 in July but failed to hold the move, leading to another test of trendline resistance.
A confirmed breakout would require SOL to close above the trendline and reclaim the $80–$84 area. Such a move would weaken the long-running bearish structure and support a larger trend reversal.
Lucky’s chart maps a possible return toward the previous high after a breakout. Still, the $253 target represents a longer-term scenario that requires SOL to recover $100, $160 and several additional resistance levels first.
Morgan Stanley Launch Adds Institutional Focus
Morgan Stanley’s Solana Trust added an institutional element while SOL tested support. The Morgan Stanley Solana Trust began trading on NYSE Arca under the MSOL ticker. It provides exposure to SOL and returns part of the staking income generated by the trust.
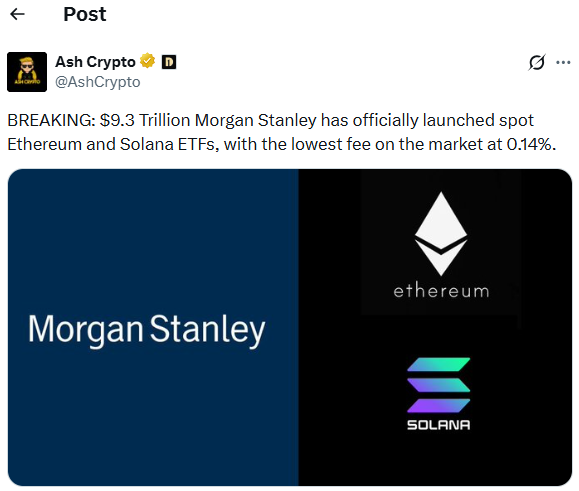
The trust’s delegated sponsor agreement listed an annual management fee of 0.14%. The product’s registration documents also established creation and redemption procedures for authorised market participants. The U.S. Securities and Exchange Commission filing showed Morgan Stanley amended the registration in May.
Morgan Stanley’s entry expands regulated access to Solana through traditional brokerage accounts.
However, an exchange-traded product launch does not guarantee large inflows or an immediate SOL price recovery.
Its effect will depend on investor demand, staking returns, trading liquidity and broader crypto conditions.
Solana price must still defend $72 before the institutional narrative can support a stronger technical recovery.
A move above $76 would improve short-term momentum. Reclaiming $80–$84 would provide stronger evidence that buyers had regained control.
A daily close below $72 would instead expose $67.63 and the wider $58–$61 demand region.