Doge Pepe
 Wisp
Wisp Pons
Pons Zylo Ecosystem
 Bunker Mode
 Quantus
 Pearl
Pearl

Ethereum price continued consolidating near $2,500 after a sharp recovery from its mid-August range. ETH reached an Aug. 27 high near $2,560 before settling back around the $2,500 region.
The move followed a breakout from the $1,875-$1,950 area that contained Ethereum through much of August. ETF inflows, short covering, and broader crypto-market strength supported the advance, but ETH now faces resistance near $2,550-$2,560.
Ethereum Price Prediction: ETH Tests Resistance Near $2,550
Ethereum price traded around $2,500 after breaking above the $1,875 to $1,950 range that contained the token through much of August. Buyers also pushed ETH above resistance tied to the February-to-May trading range. The price has since held near $2,500, keeping the breakout intact as the market waits for another directional move.
ETH crypto daily chart indicated stronger buying pressure than selling pressure during the latest move. The next daily levels stood near $2,656 and $2,812, with $2,969 also appearing as a higher resistance level on the same setup.
Meanwhile, analyst Crypto Patel has pointed to Ethereum price current structure as a potential repeat of previous post-Bitcoin-halving cycles. ETH is moving through an accumulation phase ahead of previous major price advances, with similar consolidation patterns observed across earlier cycles.
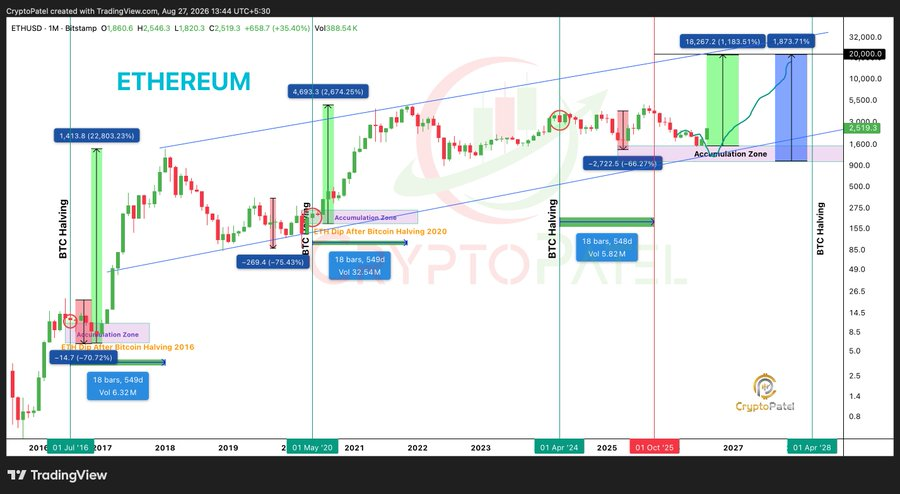
Crypto Patel’s analysis suggests that a breakout from the current accumulation zone could open the way for a larger upward move. Ethereum price prediction projects a potential target above $20,000 if the historical pattern continues. However, the prediction remains dependent on Ethereum sustaining its long-term breakout structure and broader market conditions.
ETF Inflows and Short Covering Support Ethereum Price
US spot Ethereum ETFs recorded about $697.2 million in net inflows during the week ending Aug. 21, marking their strongest weekly inflow performance of 2026. Bitcoin and Ethereum funds together attracted roughly $2.6 billion over the same period. Continued ETF demand gave the spot market additional support after ETH recovered from its August consolidation.
The US Treasury also raised planned long-end bond buybacks from $2 billion to $4 billion per operation, starting Sept. 9, improving liquidity conditions for markets.
Also, nearly $3 billion in leveraged crypto positions faced liquidation within 24 hours, with short positions accounting for about 92% of the total. Ethereum price gained roughly 18% during the move as bearish traders closed positions, adding buying pressure to the market.
Ethereum Price Faces Liquidity Cluster Above $2,500
The four-hour chart showed ETH trading above the Bollinger Band midpoint near $2,477. The upper band sat around $2,514, while the lower band stood near $2,441. A move above the upper band would place attention on the $2,550 area, while a break below the midpoint could bring the lower band into view.
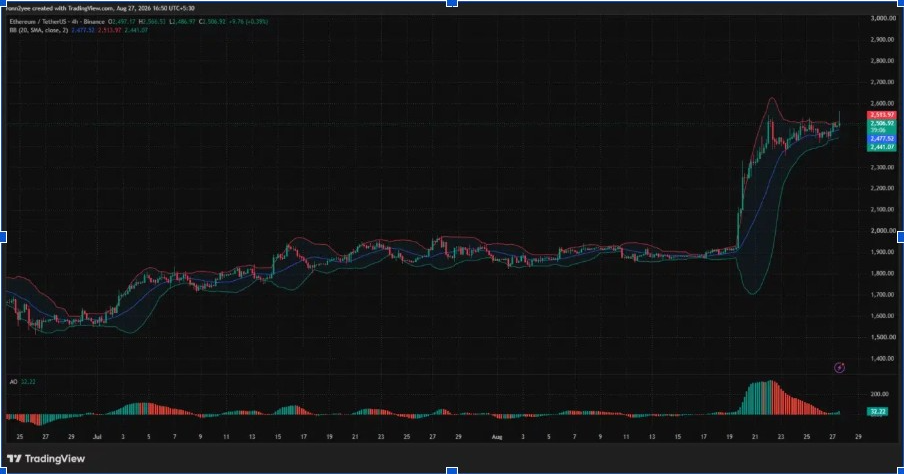
CoinGlass data showed a dense liquidation cluster around $2,545 to $2,555. Another major liquidity area appeared near $2,410 to $2,420 below the market. Ethereum price could test either zone as leveraged positions build, while the $2,343 level and $2,187 pivot remain support points.