Doge Pepe
 Crawlerpad
 Zylo Ecosystem
 Quant
Quant Starknet
 NEAR Protocol
 Sonic
Sonic
XRP price has continued to underperform the crypto market. In September, it remained inside a narrow consolidation even as tokens like Quant, Near Protocol, Midnight, and Raydium soared by triple digits. This article looks at what to expect in October and whether it will bounce back.
XRP Price Has Bullish Technicals
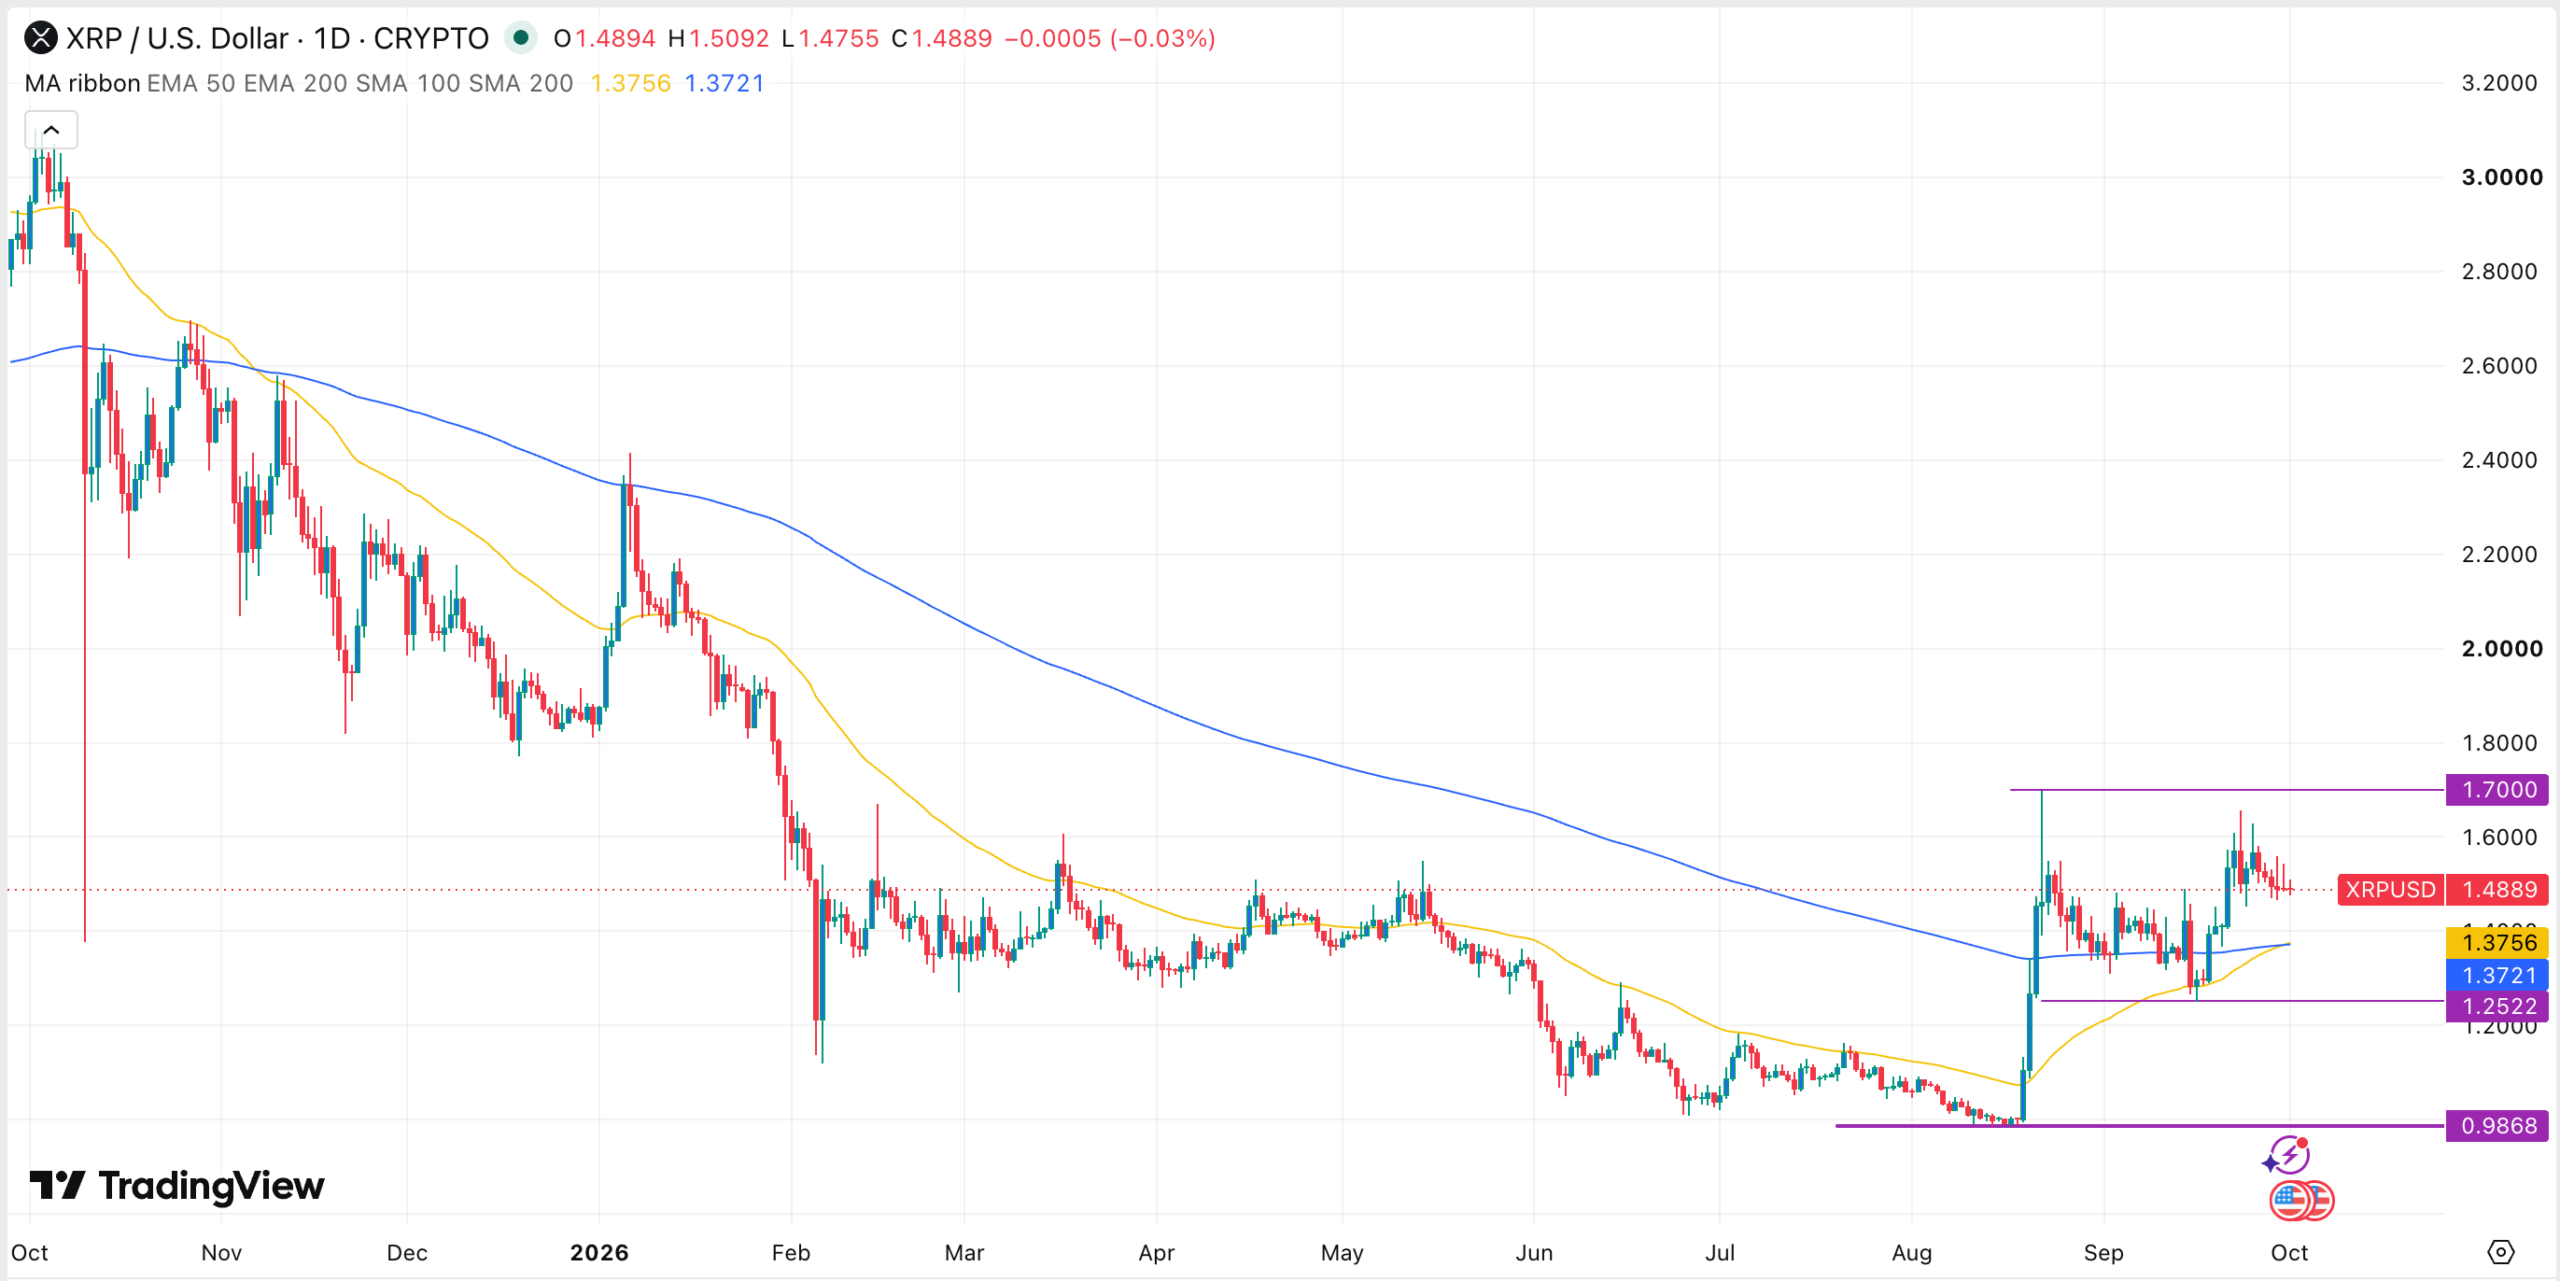
The daily chart shows that XRP price has moved sideways since August. It has remained inside the narrow range between the support and resistance levels of $1.2522 and $1.6565.
A closer look shows that the coin has encouraging technicals. It has just formed a golden cross pattern, which happens when the 50-day Exponential Moving Average (EMA) moves above the 200-day average. The last time XRP formed a golden cross was in November 2024, which led to a parabolic move.
XRP has remained above the Supertrend indicator, a sign that bulls have prevailed. Also, the Relative Strength Index (RSI) and the MACD indicators have continued to rise this month.
A closer look at the chart shows that it is slowly forming a falling wedge pattern, which consists of two descending, converging trendlines. These patterns suggest the coin is likely to see a strong bullish breakout in the coming weeks. If this happens, the initial target to watch will be the August high of $1.70. A surge above that level will signal further gains, potentially reaching the psychological level of $2.00.
XRP ETF Inflows Points to More Demand
Fundamentals suggest that XRP has some of the best fundamentals, which may lead to more gains. One of the key catalysts is the fact that spot XRP ETF inflows are soaring, a sign that American investors are accumulating the coin.
Spot XRP ETFs had over $121 million in inflows in September, with Bitwise’s XRP having over $615 million in assets. It is followed by Franklin Templeton’s XRPZ, with over $437 million in assets, and Canary’s XRPC, with $372 million.
XRP ETFs have had one month with outflows since their approval last year. They lost assets only in March, when users redeemed coins worth over $31 million. These funds now have over $1.79 billion in inflows.
The rising ETF inflows is a sign that demand among institutional and retail investors is rising, which is a bullish sign. It is a sign that it is in the accumulation phase of the Wyckoff Theory, which is then followed by the markup.
Ripple USD is Benefiting From More Inflows
XRP price may also benefit from its improving fundamentals in the stablecoin industry. Data shows that the Ripple USD (RLUSD) stablecoin is slowly gaining market share this year.
DeFi Llama data show that the RLUSD supply has continued to soar this month. It now has over $2 billion in assets. Most importantly, there are signs that the RLUSD locked up in XRP Ledger is closing the gap with the one locked in Ethereum.
These metrics are encouraging because they mean that XRP Ledger will be making more money, which it can use to burn XRP tokens.
The other potential bullish catalyst for XRP price in October is that the Federal Reserve may decide to leave interest rates unchanged now that inflation is softening. A potential deal between the US and Iran will be bullish for XRP and other tokens.
In summary, XRP has a combination of strong technicals, including the recently formed golden cross pattern and its position in the accumulation phase of the Wyckoff Theory. It also has strong fundamentals, including the rising ETF inflows.
This article is for informational purposes only and does not constitute financial or investment advice. Technical patterns and market projections do not guarantee future price performance.