Doge Pepe
 Bitway
 Optimism
 Pearl
Pearl Pons
Pons Quantus
 Starknet

U.S. spot Bitcoin ETF products reversed a weak second quarter with $6.34 billion in third-quarter inflows. Bitcoin traded near $85,967 on Oct. 2, while daily ETF flows turned negative entering October.
The quarterly reversal restored institutional demand after roughly $5 billion left the products during Q2. However, late-September and early-October redemptions showed fresh demand remained uneven despite the stronger BTC price.
Bitcoin ETF Flows Reverse After Weak Second Quarter
Farside Investors data showed U.S. spot Bitcoin ETF flows weakened sharply at September’s close. The funds recorded $148.7 million in net outflows on Sept. 30.
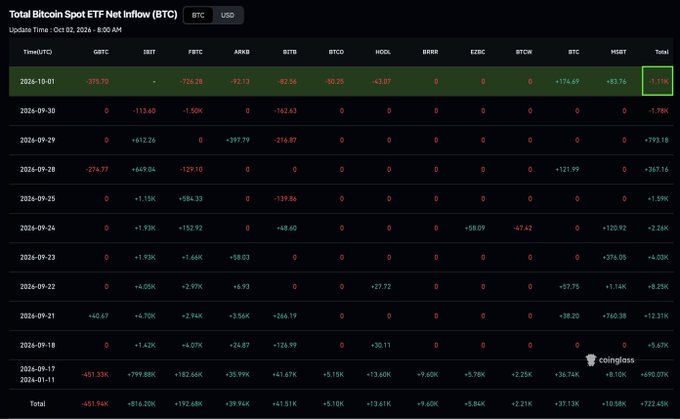
The pressure continued on Oct. 1, when combined net outflows reached $92.9 million. Fidelity’s FBTC lost $60.7 million, while Grayscale’s GBTC lost $31.4 million.
Morgan Stanley’s MSBT attracted $7 million, while Grayscale’s lower-fee Bitcoin product added $14.6 million. Those gains failed to offset redemptions across several larger funds.
The two negative sessions followed a much stronger stretch during late September. Farside recorded $999 million of inflows on Sept. 21 and $714.7 million on Sept. 22.
Quarterly data showed a broader improvement. A Benzinga data compilation put Q3 Bitcoin ETF inflows at $6.34 billion after about $5 billion left during Q2.
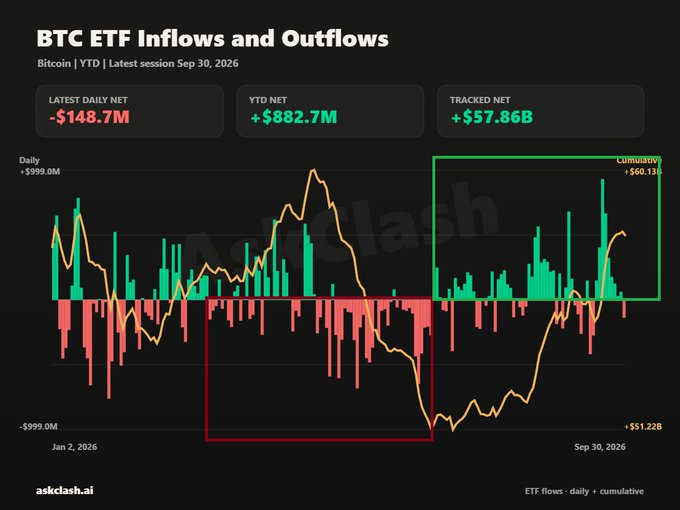
That represented an inflow swing exceeding $11 billion between the two quarters. The shift also reduced pressure from earlier institutional redemptions.
The reversal also followed uneven fund activity earlier in September. Farside recorded several negative sessions before late-month inflows accelerated.
Those swings showed how quarterly totals can hide substantial daily volatility. They also tempered the stronger institutional-demand picture entering the fourth quarter.
Bitcoin ETF Demand Meets Stronger BTC Price Structure
CoinMarketCap data showed Bitcoin trading near $85,967 on Oct. 2. The asset gained about 2% over 24 hours, with trading volume near $38.1 billion.
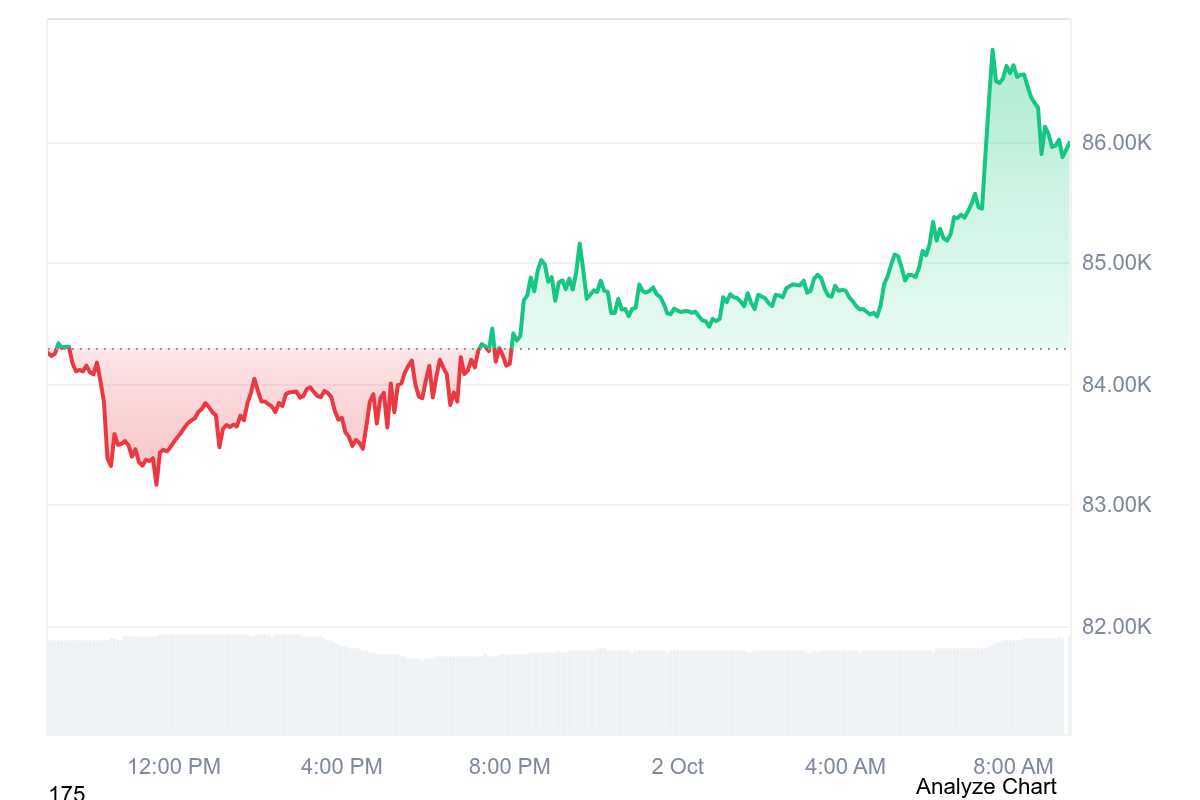
BTC price had already moved above levels seen during much of September. TradingView data showed Bitcoin repeatedly testing the $82,000 area during late September.
That zone now sits below spot price and remains an important near-term reference. A break below it would weaken the recent recovery structure.
The stronger spot market also supported exchange-traded product valuations. BlackRock’s iShares Bitcoin Trust reported $67.06 billion in net assets on Sept. 30.
BlackRock listed IBIT’s closing price at $47.34 that day. The fund held Bitcoin and tracked the CME CF Bitcoin Reference Rate.
BlackRock’s fund remained the largest listed product by assets among U.S. spot Bitcoin ETFs. Its scale can translate modest percentage moves into large dollar flows.
The scale of IBIT matters because its flows can dominate aggregate ETF demand. However, Farside reported no IBIT flow for Oct. 1.
That left Fidelity and Grayscale redemptions driving the aggregate daily result. The divergence showed why headline ETF totals can mask fund-level differences.
Bitcoin ETF Flows Contrast With Futures Positioning
Chicago Mercantile Exchange data showed October Bitcoin futures near $83,930 on Sept. 28. That level sat below the latest spot BTC price.
The gap showed spot Bitcoin had advanced after that futures snapshot. It also showed why traders compare ETF demand with derivatives pricing.
CME’s October contract remained active through Oct. 30. That gives traders another benchmark for positioning into month-end.
The contract can also show whether futures pricing confirms movements in the spot market. ETF flows measure net creations and redemptions across listed products.
Futures markets instead reflect leveraged positioning, hedging demand, and settlement expectations. Those signals can diverge across several trading sessions.
Strong quarterly ETF inflows therefore do not guarantee uninterrupted daily buying. The latest flow pattern supported that distinction.
Institutional demand improved during Q3, but two consecutive outflow sessions opened the fourth quarter. That leaves the near-term picture less uniform than quarterly figures suggest.
BTC Price Faces $82K Support as ETF Flows Stay Mixed
Bitcoin’s next market test sits near the $82,000 area identified by recent TradingView data. That zone acted as resistance before the latest move higher.
ETF flow data will provide another daily confirmation. Farside updates U.S. spot Bitcoin ETF creations and redemptions after each trading session.
If flows return positive while BTC price holds above prior resistance, institutional demand would align with spot momentum. Continued outflows would leave the quarterly rebound intact but weaken the near-term setup.