
 Bitcoin
 Pearl
Pearl Starknet
 Zerebro
 NEAR Protocol
 Solana
 Quantus

Key Insights:
- Ethereum is currently trading at $2,062, showing a 1.18% intraday pullback after retesting the $2,000 psychological level.
- Ethereum’s short-term recovery indicated a possible rebound. The long/short ratio stood at 1.2287, with long positions making up 55%.
- Ethereum ETFs currently manage $7.17 Billion in assets. This marks a net-zero flow for the seventh consecutive day since their launch in the U.S. market.
Ethereum price has remained steady, just below the $2,000 mark. This level serves as a significant psychological threshold for the market.
Traders and analysts are closely observing resistance levels for Ethereum. Market signals suggested a short recovery period could push ETH price toward $2,800.
Ethereum Price Movement and Short-Term Recovery
At press time, Ethereum price traded at $2,062 as it moved towards testing the vital $2,000 threshold. The price experienced a temporary 1.18% decline as Ethereum returned from its $2,100 resistance level.
Despite the decline in daily trading prices, Ethereum maintained its upward trend. It successfully held above the crucial $2,000 psychological support level.
The 4-hour price chart shows signs of reversal as Ethereum demonstrates early signs of short-term recovery. Price action has recovered from its previous position below $2,000. This indicated that ETH price may obtain renewed power in the future.
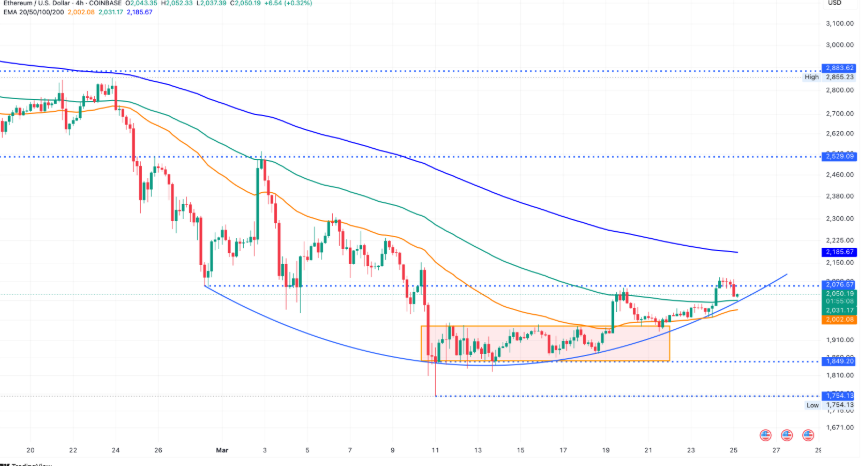
Technical market indicators show increasing positive sentiment because the long/short ratio has reached 1.2287. Long positions surpass short positions by 55% of total contracts. This indicates an increase in investor positions focused on buying ETH.
Institutional Activity and Ethereum ETFs
Ethereum’s institutional adoption is growing steadily. This is driven by innovative investment options like exchange-traded funds (ETFs) built on the ecosystem.
Ethereum ETFs currently manage $7.17 Billion in assets. These holdings account for 2.85% of Ethereum’s total market capitalization. Since ETFs made their U.S. debut, the Ethereum network has experienced no net inflow for seven straight days.
More so, Ethereum ETFs have received $2.42 Billion in net capital inflows, demonstrating extended institutional interest in this cryptocurrency. The current net-zero investment period does not reflect a decreased institutional interest or a reduced investment capital.
Ethereum Price Predictions
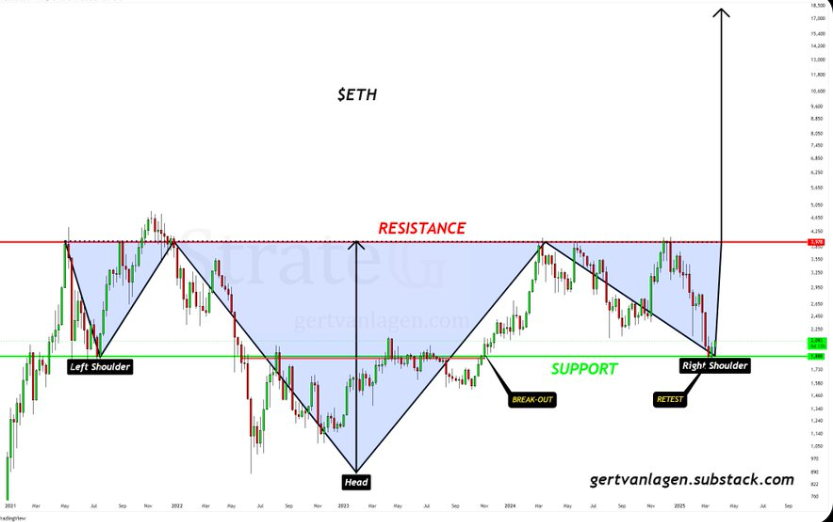
Crypto analyst Gert van Lagen has identified a potential pattern of inverted head-and-shoulders on the weekly Ethereum price chart. Crypto has displayed an upward trend between $1,800 and $2,000 from the support area, indicating the pattern’s completion.
Van Lagen suggested that the short-term upward movement could indicate the start of a right shoulder formation. This aligned with a $4,000 neckline projection, highlighting bullish potential for the ETH price.
Crypto analyst Michael Van de Poppe is analyzing Ethereum’s $2,150-$2,200 range. He aims to assess whether this zone will act as resistance to the Ethereum price.
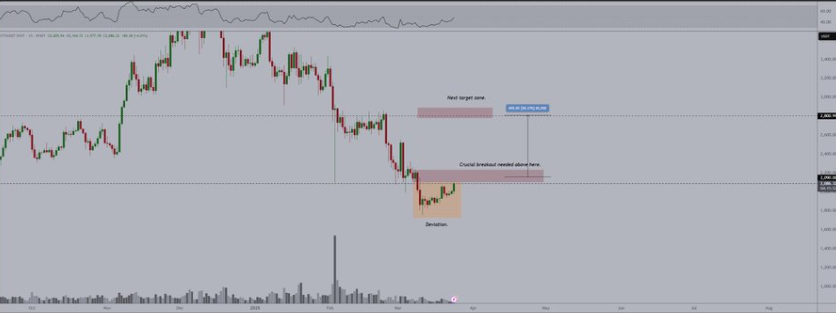
A breakout above this resistance area could pave the way for Ethereum’s subsequent rally. Its major price target stood at $2,800.
Analyzing the Market Sentiment and Next Steps
Along with increasing optimism, the derivatives market signals a bullish sentiment in Ethereum’s current market outlook. Ethereum futures market traders display rising confidence about Ethereum’s upcoming performance because they maintain an open position direction.
Furthermore, The open interest in Ethereum derivatives reached $21.75 Billion. It recorded a 3.21% rise throughout the last 24 hours.
Analysts believe increasing investment interest is bolstering Ethereum’s prospects. This momentum could help ETH price reach its $2,800 target soon.
Disclaimer
This article is for informational purposes only and provides no financial, investment, or other advice. The author or any people mentioned in this article are not responsible for any financial loss that may occur from investing in or trading. Please do your research before making any financial decisions.




