
 Zylo Ecosystem
 Pearl
Pearl Walrus
 Derive
 Quantus
 Aerodrome Finance
 Sui
Sui

Key Insights:
- Bitcoin’s hashrate surge signals growing network strength and miner confidence.
- Historically, Bitcoin‘s price follows hashrate movements with a delay.
- BTC holds firm as stocks and gold drop, showing safe haven potential.
Bitcoin price is showing signs of strength across several key indicators, with analysts pointing to growing hashrate, stable price action during market downturns, and potential breakout patterns on the chart.
Bitcoin Hashrate Increases, Suggesting Miner Confidence
Over recent months, the rise of Bitcoin’s hashrate has been fairly stable. Hashrate is the total computational power on the Bitcoin network that is used to mine and secure. Often an increase in hashrate also means greater miner participation and improves network strength.
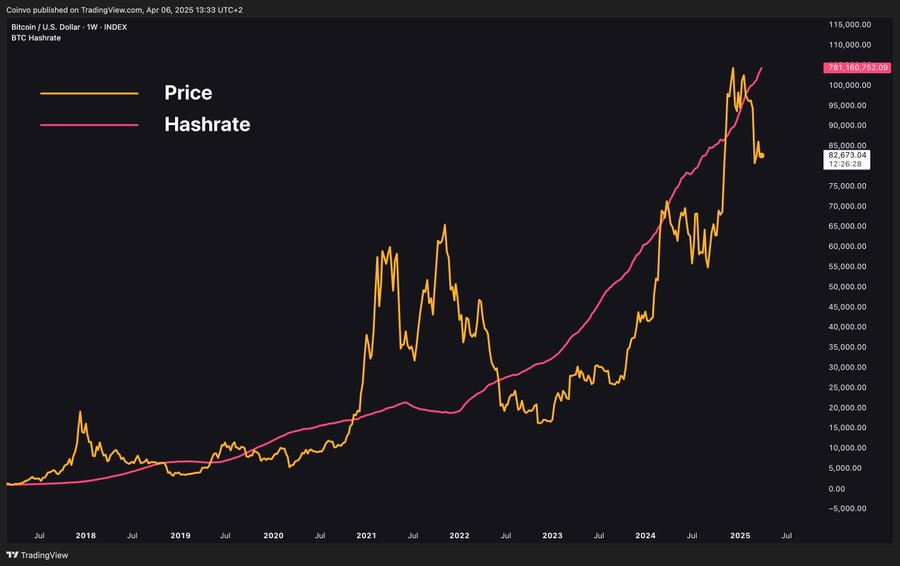
Generally, an increase in hashrate functions as a leading indicator for Bitcoin’s price. Historical data reveals that as hashrate rises, Bitcoin tends to also rise within a delay. The rising hashrate currently is thought of as a miner indicating better profitability and that miners are confident that the long term value of the network will rise.
In this case, the rapid increase in hashrate in recent months resembles previous cycles that were followed by major price increases. Market participants are now watching closely for signs that Bitcoin’s price could follow a similar path, potentially reaching $100,000 or more if the trend continues.
Bitcoin Stays Strong as Gold and Stocks Fall
This is notable for broader market weakness. The S&P 500 has had a sharp drop, and gold has fallen below key support levels. Consequently, both traditional assets are under pressure while Bitcoin is holding up.
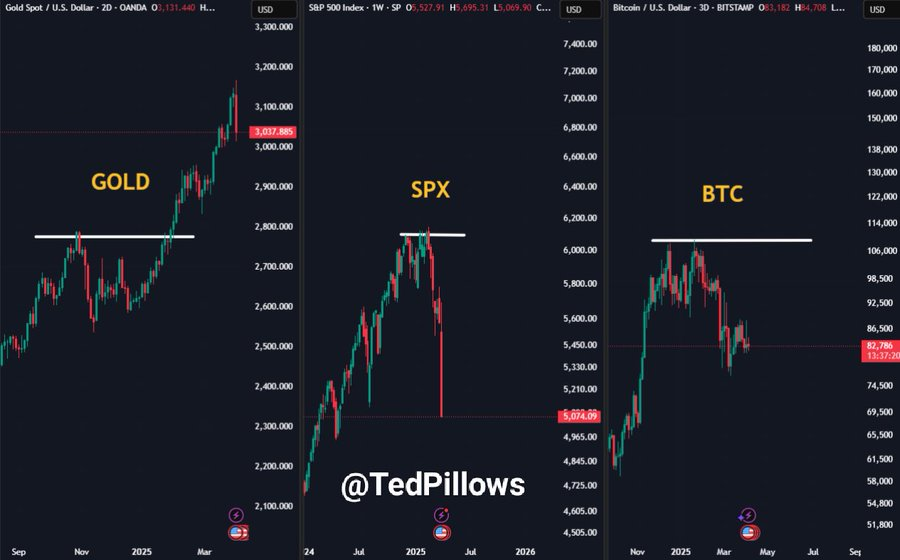
“Gold is dumping, S&P 500 is crashing like a rug-pulled memecoin.”TedPillows added but $BTC is holding like a chad. He compares the current behavior to what happened in August and September of last year, as Bitcoin was generally stable during a period of market uncertainty, which preceded a strong rally.
For this reason market analysts are treating Bitcoin as a safe haven in periods of market volatility. If other markets decline and Bitcoin is able to stay stable in price, it may be the breakout in progress.
Key Indicators Suggest Potential for a Rebound
Technical analysis shows that Bitcoin is possibly forming a double-bottom pattern. The pattern is characterized by two price lows at the same levels and a breakout above the resistance line. It usually signifies the end of a downtrend and the start of an upcoming upward move.
Similarly, a second bottom formed at a similar level, which could reinforce the potential for a trend reversal. The pattern would be confirmed by a breakout above $83,500, which could see Bitcoin continue to new price targets. Based on this pattern the projected targets are $90,000 and $110,000.
Relative Strength Index (RSI) valued at 43.75 slightly below the midline at 50.neutral level. This means the market is not overbought or oversold, which is still a place for upward price move if momentum builds up.
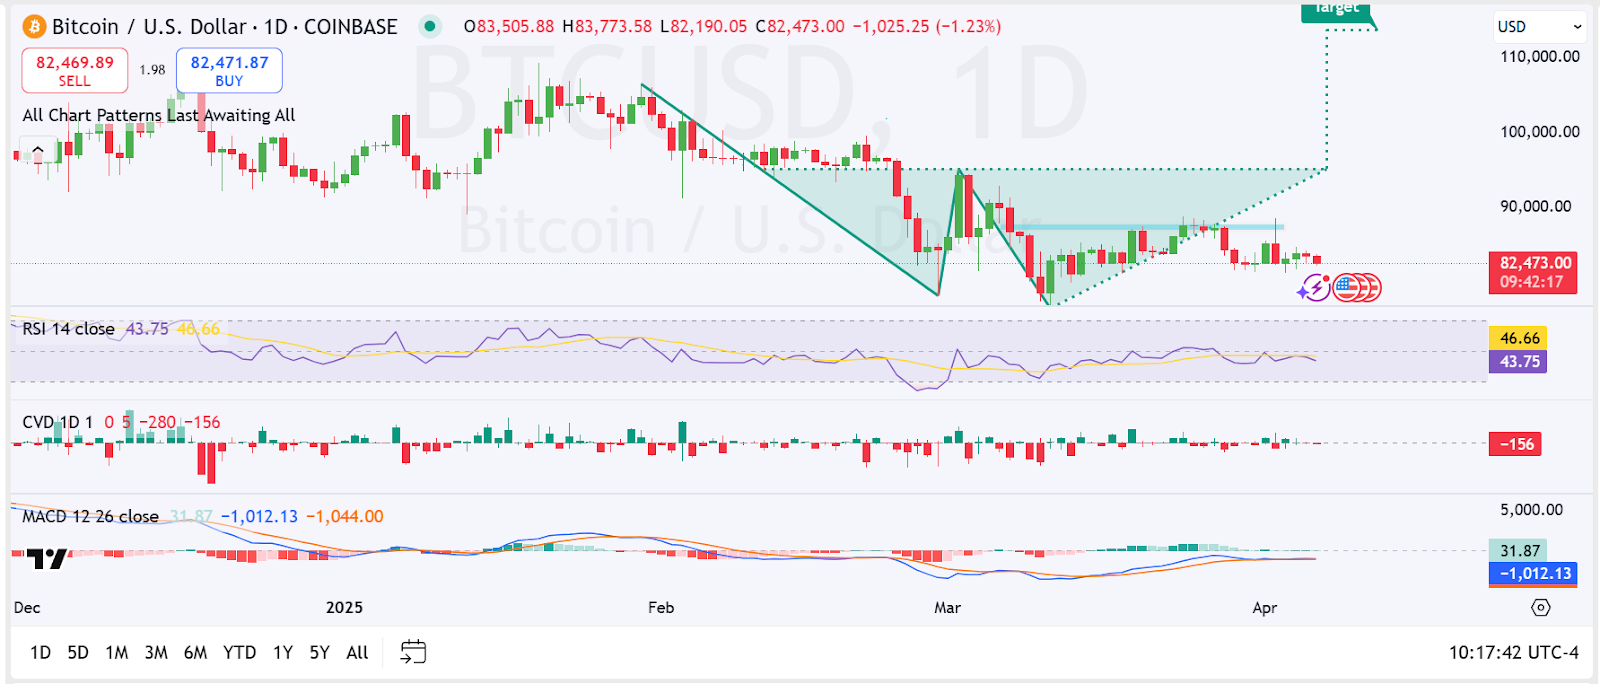
Currently at -156, the CVD is negative, meaning that the number of sell orders exceeds that of buy orders. Yet, this condition happens frequently in price consolidation periods and may change in the event of stronger buying pressure.
Meanwhile, the MACD (Moving Average Convergence Divergence) is showing a bearish crossover, with the MACD line below the signal line. This indicates a slowdown in upward momentum, but the signal could reverse if bullish volume returns to the market.
Parabolic Structure Could Support Longer-Term Rally
According to analyst Danny_Crypton, Bitcoin’s current structure mirrors previous parabolic runs seen in 2018 and 2021, both of which led to new all-time highs.
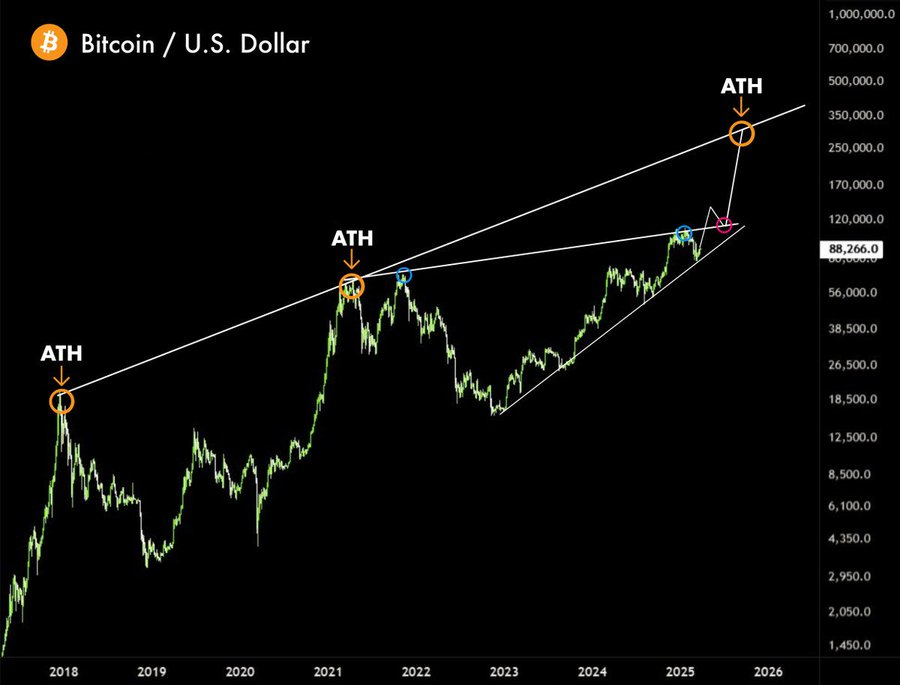
“Today is the start of the big race to the ATH and Altseason,” he said on X, pointing to rising liquidity, a rising RSI, and a recent Golden Cross as bullish signals.
If the pattern holds, Danny_Crypton forecasts BTC price reaching $300,000 by late 2025 or early 2026. While such projections remain speculative, the technical alignment supports a constructive long-term view.
Disclaimer
In this article, the views and opinions stated by the author or any people named are for informational purposes only, and they don’t establish the investment, financial, or any other advice. Trading or investing in cryptocurrency assets comes with a risk of financial loss.




