
 Pearl
Pearl Zylo Ecosystem
 Sui
Sui Starknet
 Pons
Pons NEAR Protocol
 Quantus

Key Insights:
- Bitcoin’s RSI divergence points to potential upside reversal.
- Price faces key resistance at the 200-day EMA.
- Traders expect volatility ahead of tariff and earnings updates.
Bitcoin price traded near $86,000 on Apr. 13 after bouncing from fresh local lows earlier in the week. However, traders remained cautious, warning that the rally could be a weekend fakeout.
The move followed comments from U.S. President Donald Trump, who announced tariff exemptions on select Chinese imports. Markets responded positively, and Bitcoin reclaimed its weekly losses to post a 7% gain.
BTC/USD touched $86,000 for the first time since Apr. 2, according to TradingView. However, it quickly dropped below $84,000 as the weekend set in—echoing familiar volatility patterns driven by lower liquidity in traditional markets.
Rising Wedge and Resistance at $85K Raise Doubts
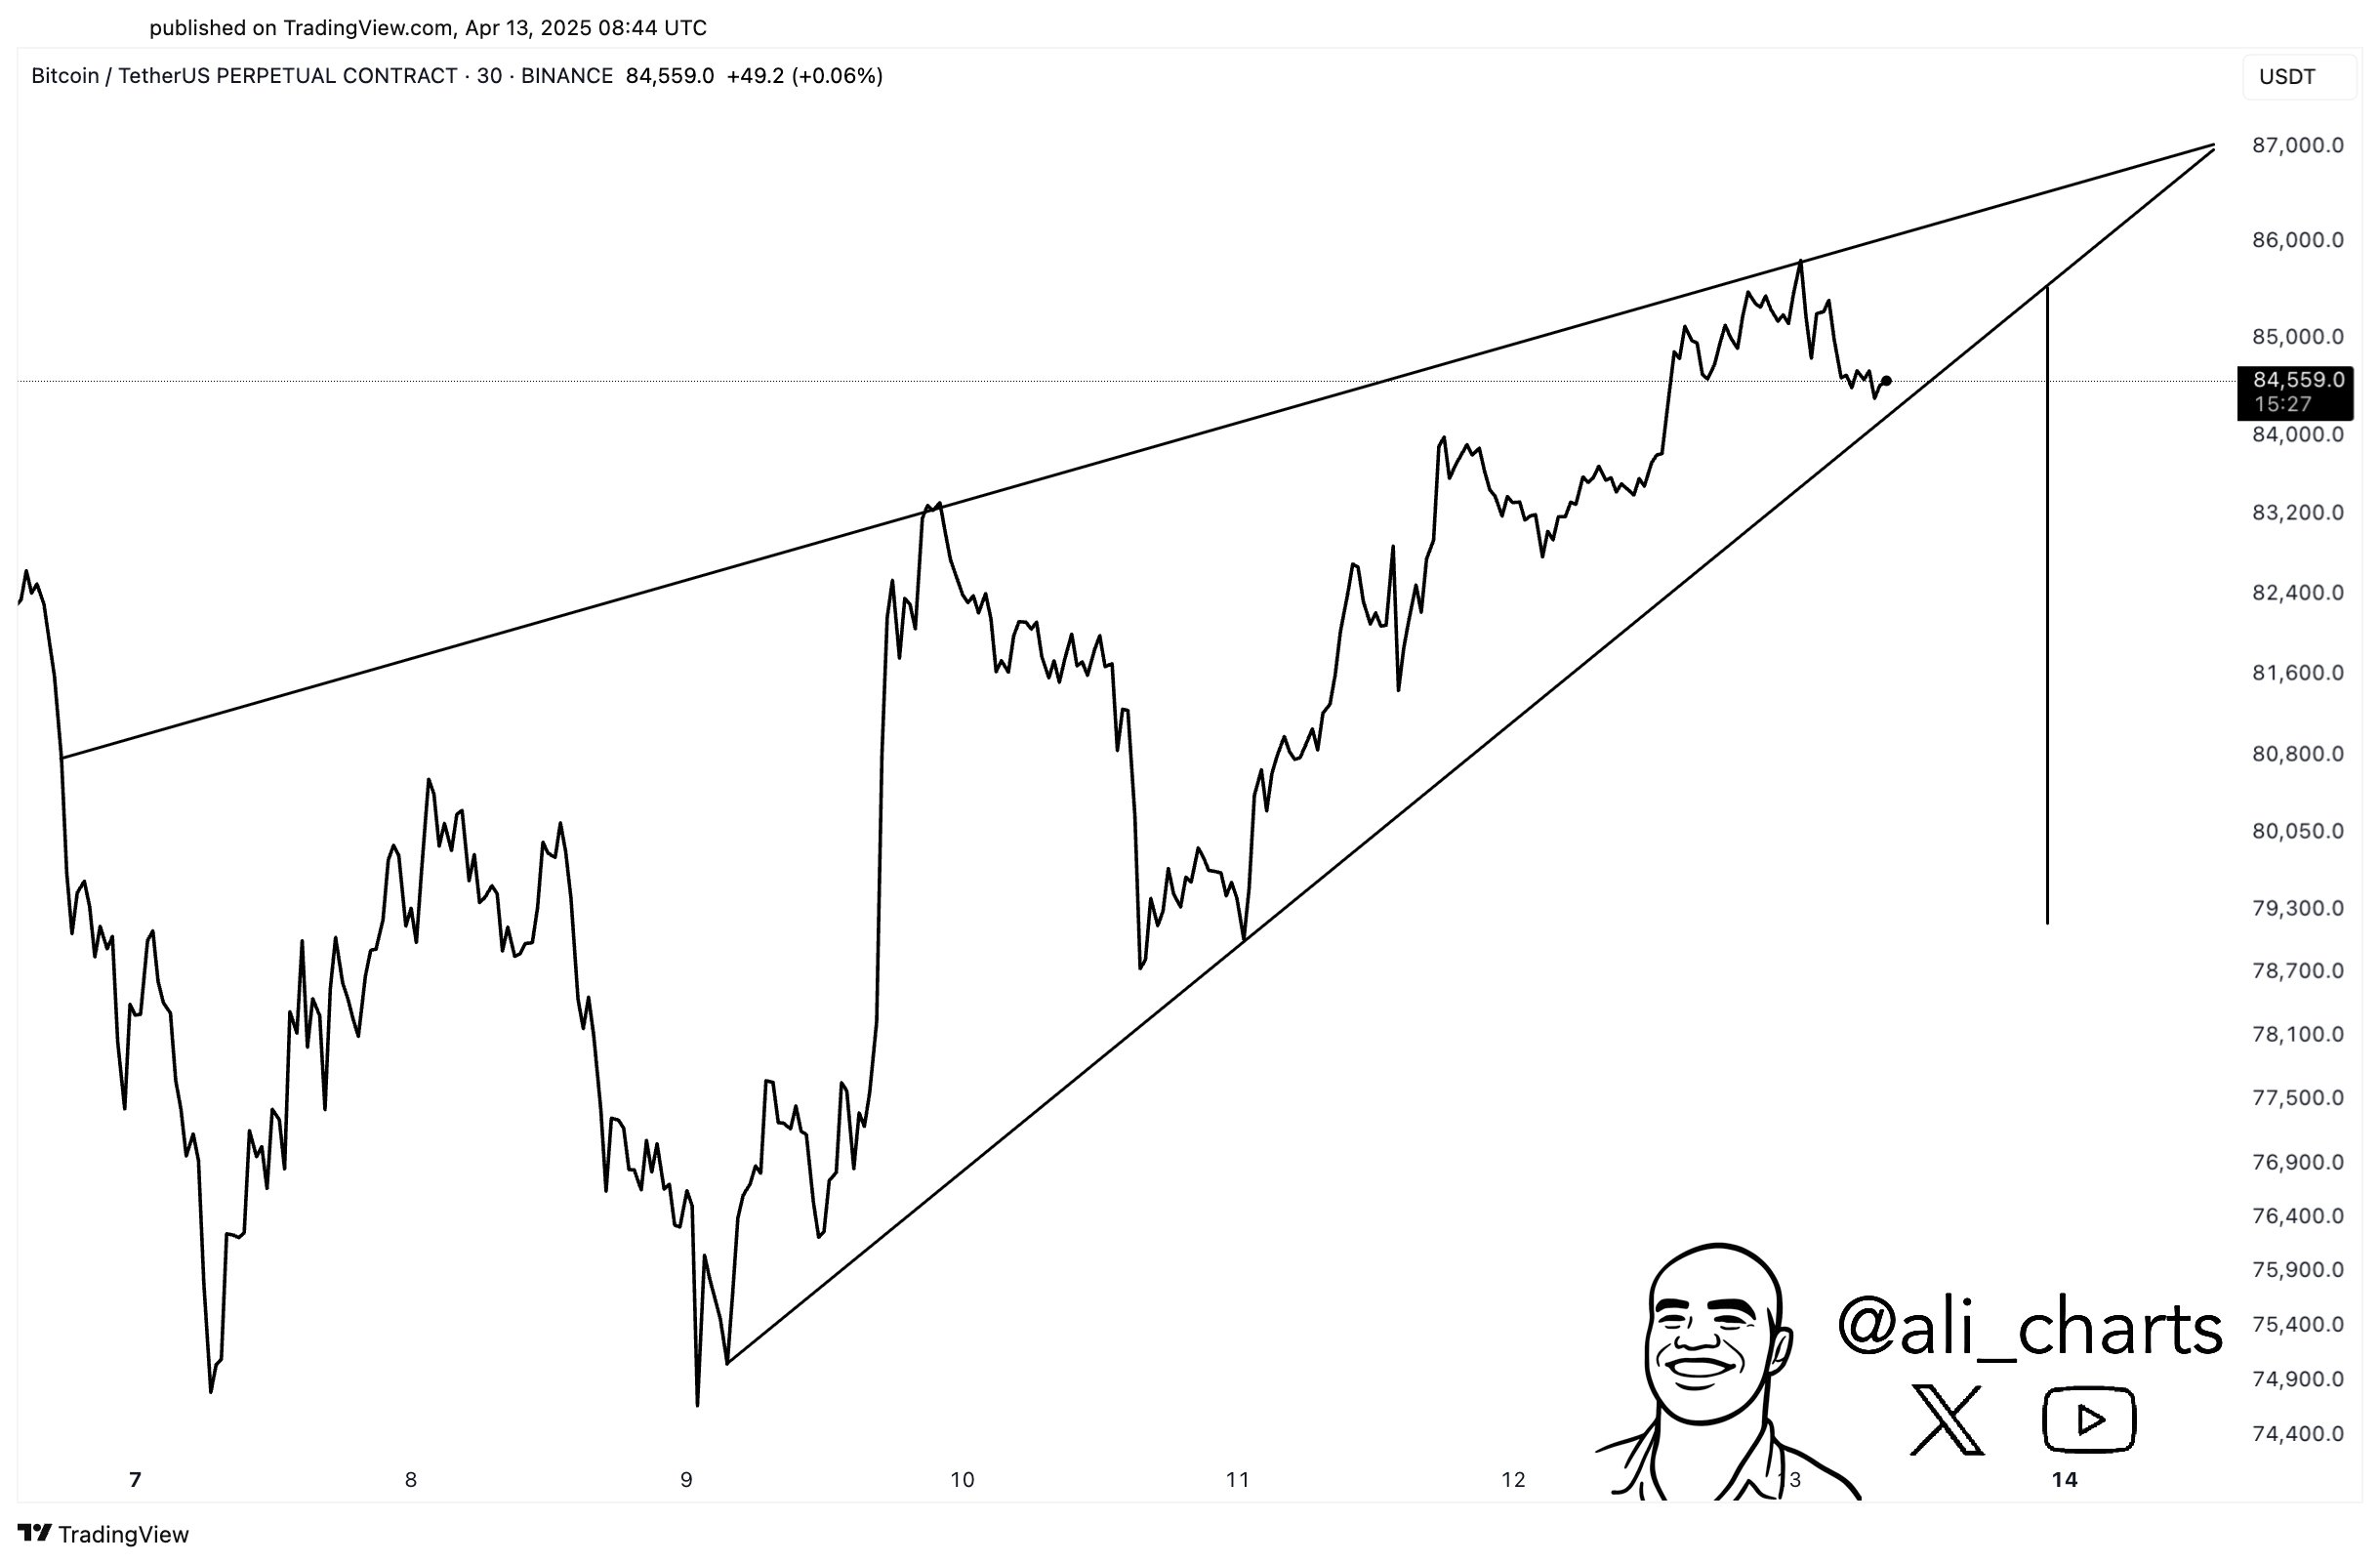
Ali Martinez flagged a possible rising wedge on the Bitcoin chart, a pattern that often signals downside risk. He suggested a potential retest of $79,000 if the pattern confirms.
Meanwhile, Daan Crypto Trades noted that Bitcoin’s latest surge still sat within a broader resistance zone. “This is however still a weekend move so far,” he wrote, referencing the 200-day exponential moving average (EMA) near $85,000. He warned that upcoming tariff decisions and tech earnings could inject further volatility next week.
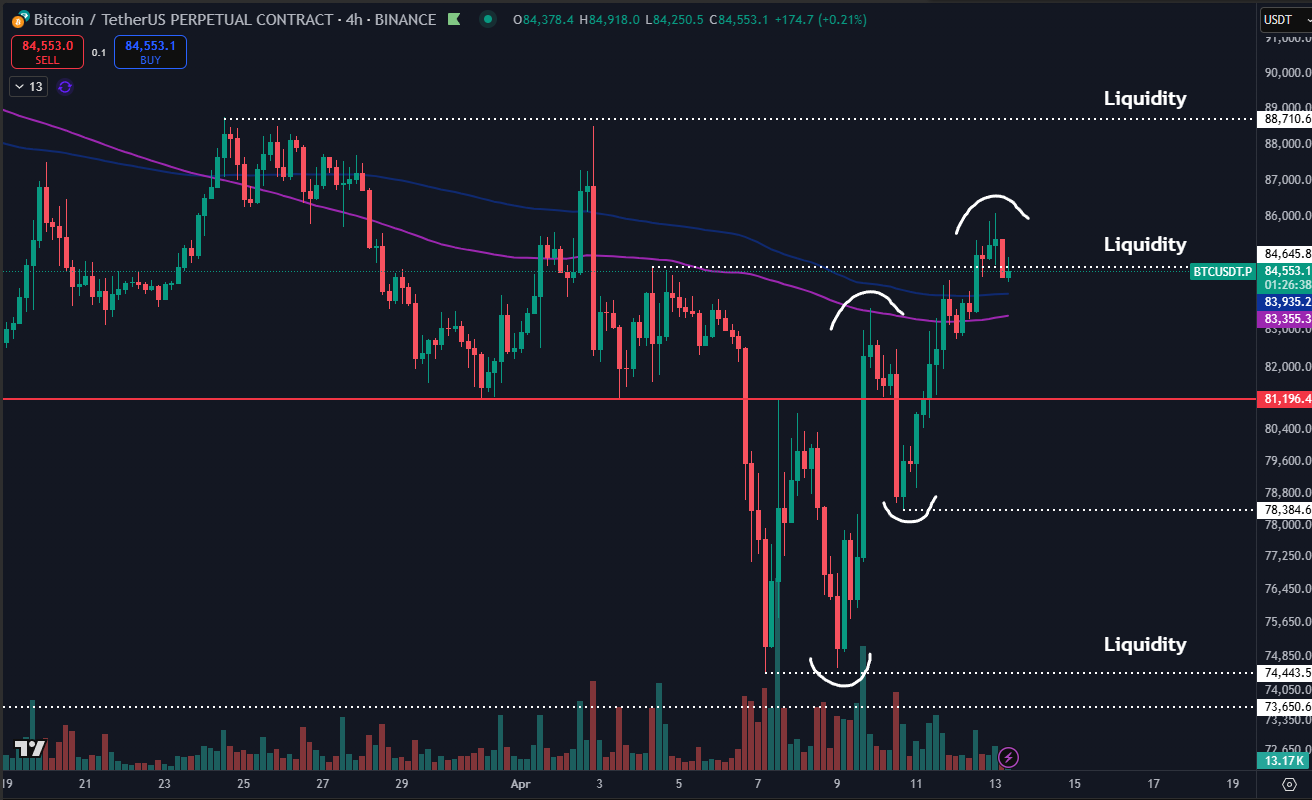
Popular trader Ak47 projected a push to $88,000 as part of a potential liquidity grab. He warned that such a move could trap long positions before a deeper dip toward $81,000.
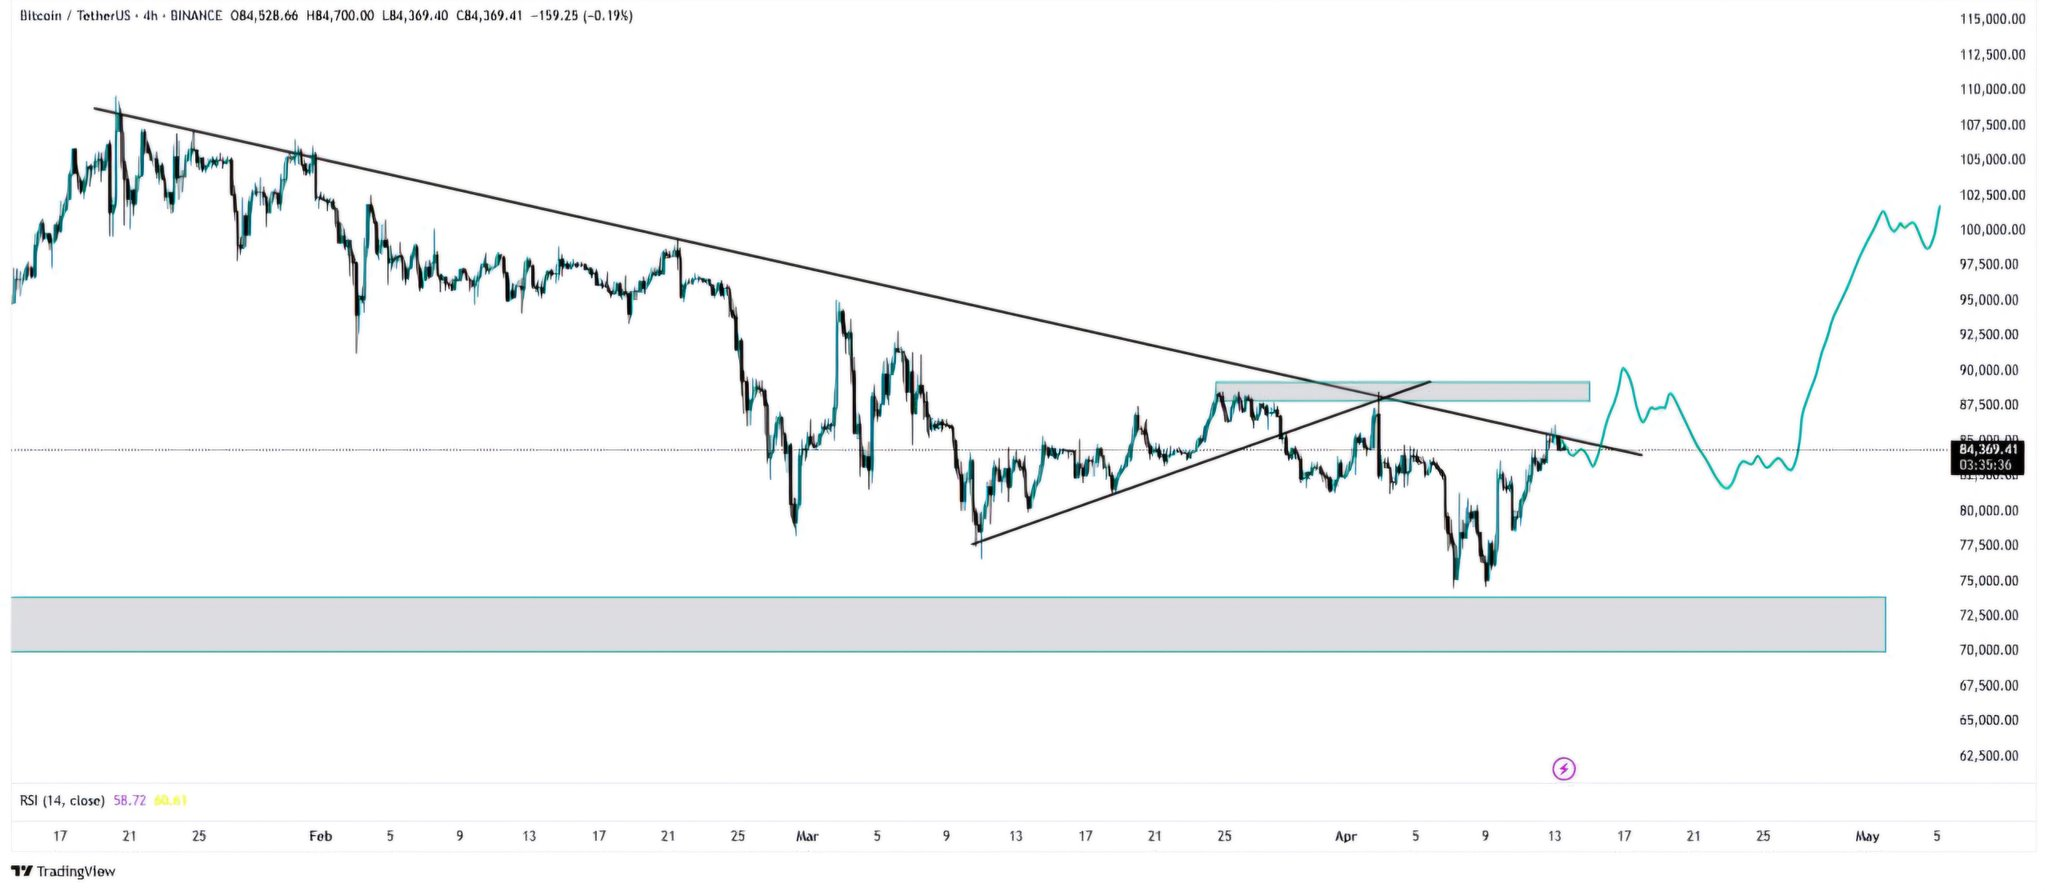
He described the pattern as setting up for a possible inverse head and shoulders, a structure that could launch BTC toward the $95,000–$100,000 range if confirmed.
Bitcoin Price Rebound Still “More Corrective” Than Impulsive
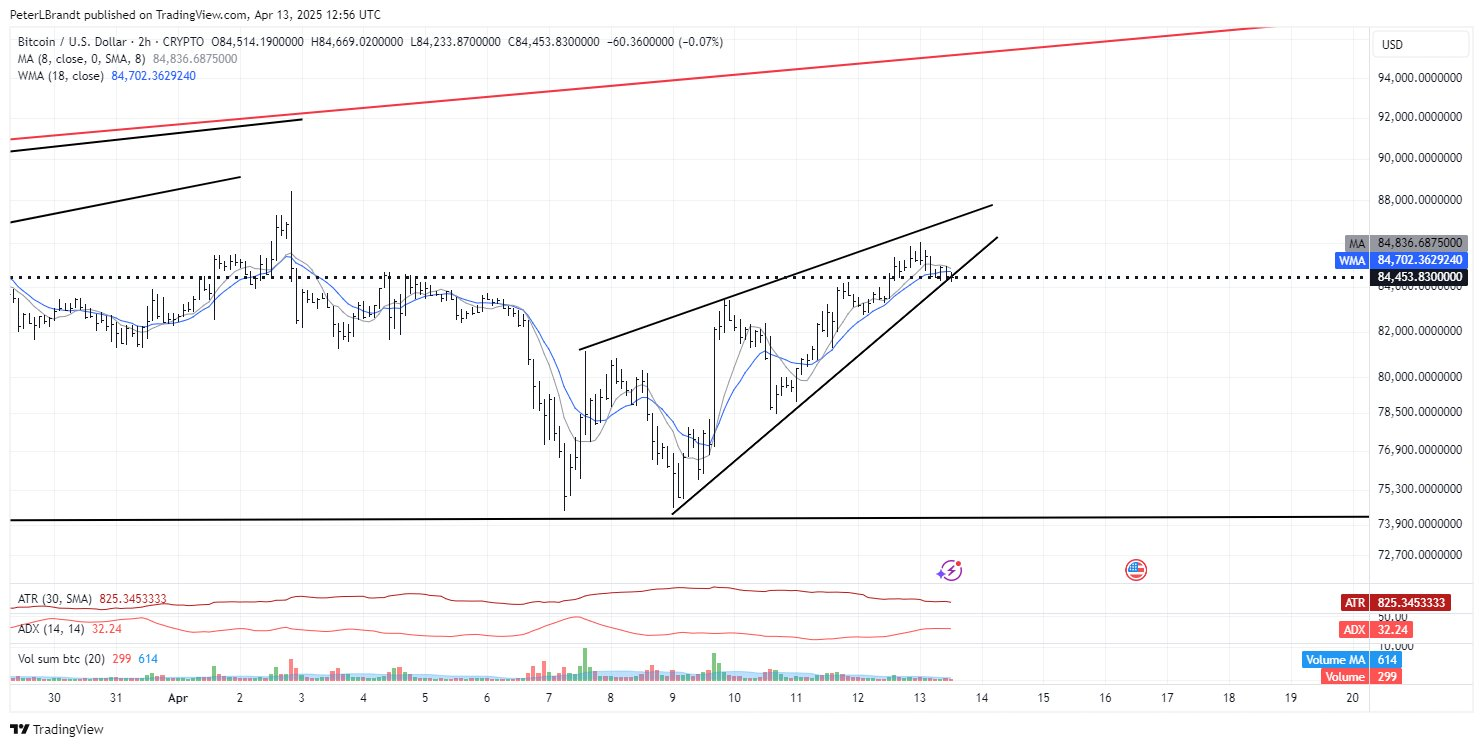
Veteran chartist Peter Brandt described the rebound from sub-$80,000 lows as “more corrective than impulsive,” implying a lack of sustained buying pressure.
Rekt Capital also weighed in, noting that BTC had closed above its long-term daily downtrend—a level that has capped price since late 2024. While the breakout appeared promising, he cautioned that previous closes above this trendline failed to sustain without a successful retest.
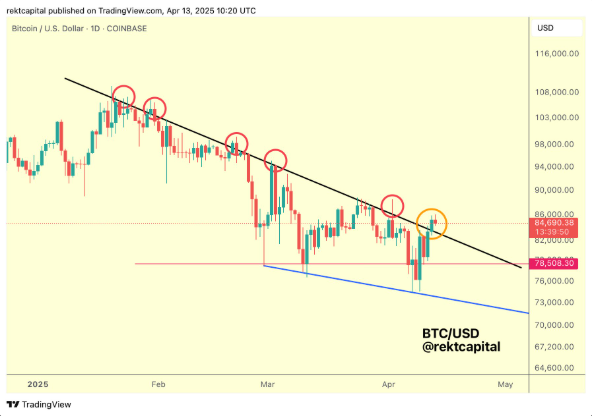
“The retest needs to be successful and it is in progress,” Rekt Capital noted on X. His chart highlighted several failed breakout attempts in the past, marked by red circles.
RSI Divergence Signals Underlying Bullish Momentum
Despite mixed price action, Bitcoin’s relative strength index (RSI) showed signs of bullish divergence on the daily timeframe.
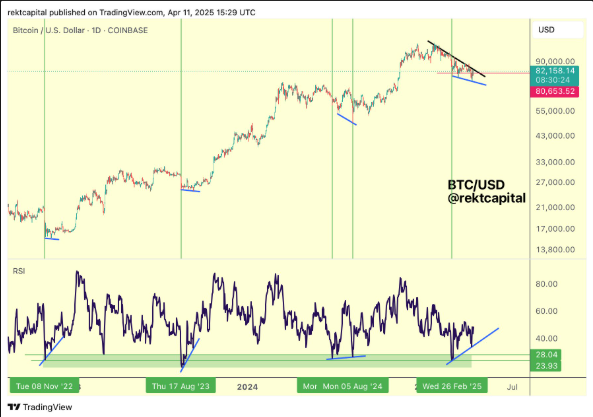
Rekt Capital pointed out that Bitcoin continued to form higher lows on the RSI while printing lower lows on price—typically a leading signal of a reversal.
That backdrop has kept bulls hopeful, even as macro uncertainty continues to weigh on risk assets.
Tariff Uncertainty and Earnings Season to Steer Market
Looking ahead, traders expect the coming week to bring renewed volatility. Tariff policy updates and major U.S. tech earnings could act as catalysts.
Traditional markets remain closed over the weekend, increasing the impact of crypto-specific catalysts in low-liquidity conditions. This often distorts price discovery and has historically led to sharp but short-lived Bitcoin moves.
Whether BTC holds current levels—or falls back to retest support near $79,000—may depend on broader sentiment shifts next week.
As of publication, BTC traded just above $84,200, posting a 24-hour gain of 2.1% and up 7.3% for the week.
Disclaimer
In this article, the views and opinions stated by the author or any people named are for informational purposes only, and they don’t establish the investment, financial, or any other advice. Trading or investing in cryptocurrency assets comes with a risk of financial loss.



