
 Bitcoin
 Solana
 Pearl
Pearl Zerebro
 Aerodrome Finance
 LayerZero
 NEAR Protocol

Key Insights:
- Analyst Ali Charts predicts a $4,500 Solana rally through a breakout from a Cup and Handle Pattern.
- Solana DEX volumes fell from $20B to $6B, highlighting a sharp drop in meme coin trading activity.
- Solana price action has returned from early this week’s highs to nearly $150. However, the anticipation for a big move remains.
Market analysts are closely watching the current chart pattern for a potential breakout. SOL price movement suggests a surge toward $4,500. If momentum builds, this level could be tested soon.
Analyst Predicts a $4,500 Solana Price Rally
Ali Charts, a well-known cryptocurrency analyst, highlighted the Solana price pattern. He noted that it is forming a Cup and Handle on the weekly time frame, a bullish indicator.
Notably, this generally precedes an upward breakout. It could signal strength if SOL breaks above the descending trend line forming the bullish handle. A weekly candle close above this level may ignite a rally toward $4,500.
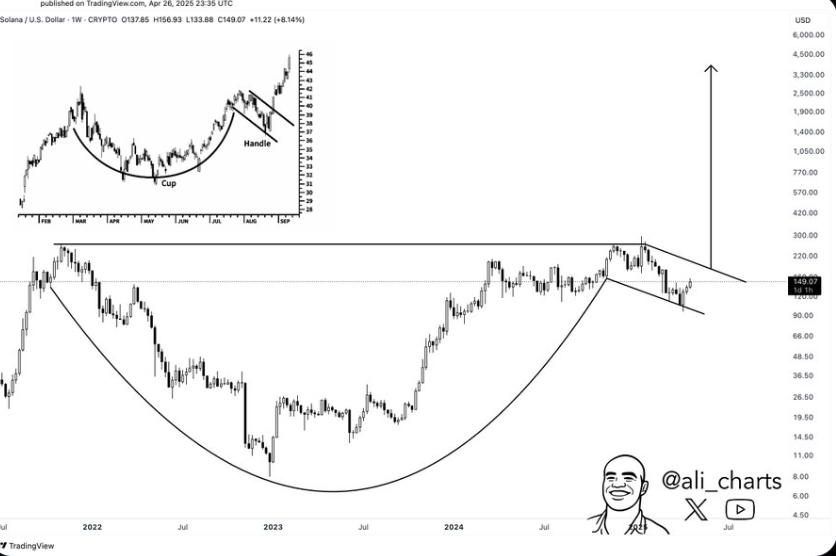
However, the analyst did not provide a specific timeframe for when such a move could occur. Historically, a Cup and Handle pattern is accompanied by substantial buying volume after the breakout point.
Nevertheless, the current market conditions seem ambiguous. Solana price action over the past few weeks might point towards external pressures that may alter such a rosy picture.
Solana DEX Volumes Data
Meanwhile, another factor directly impacting the SOL price outlook is the decline in DEX trading volume on its ecosystem. Data from DeFiLlama showed that SOL DEX volumes have dropped from $20 Billion to $6 Billion in the last week.
Consequently, this drop can be attributed to a recent aggressive trade in meme coins on the Solana blockchain. Reduced transactions could limit the network’s activity levels. This has positively correlated with Solana price movements throughout prior cycles.
Lower trading activity reduces investor interest, making it harder for the SOL to gain momentum. This presents a significant challenge for its price rally and potential breakout.
Solana Price Prediction and Technical Analysis
When writing, the Solana price was trading at $148, down by 1.98% within the last 24 hours. This decline is attributed to higher levels of uncertainty in the broader crypto market.
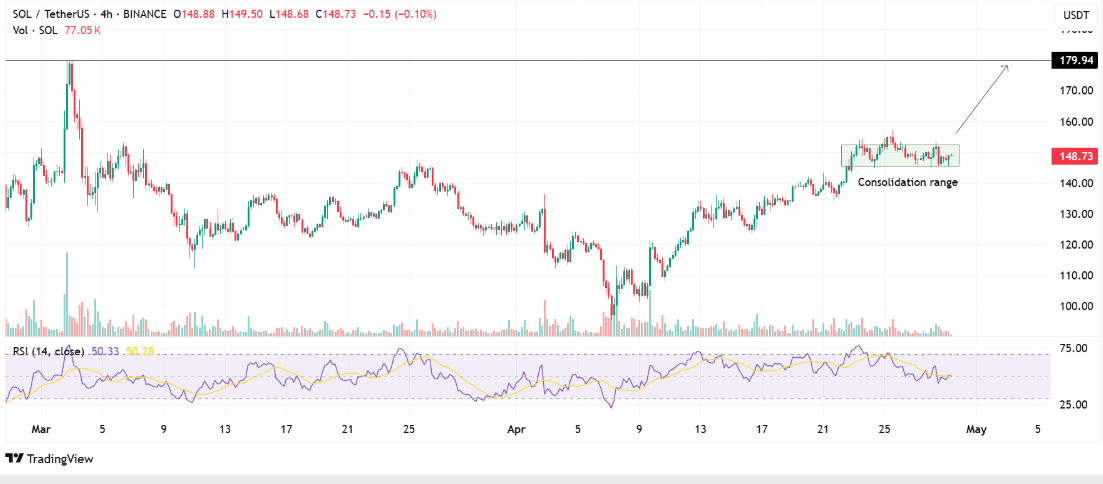
On the technical side, Solana RSI (Relative Strength Index) has moved slightly above 50. This suggested mild bullish momentum.
If this trend continues, the SOL price could challenge the $152 resistance zone. Stronger buying interest may push the target higher toward $179.
SOL may face bearish pressure if the RSI loses momentum and drops below 50. This could lead to a breakdown from its current consolidation range, signaling a potential decline.
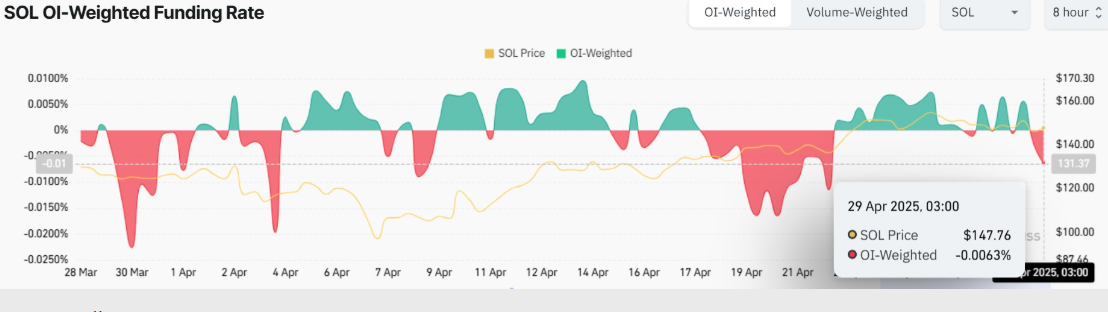
More so, data from Coinglass on funding rates also shows that future traders are bearish in the Solana market. At the moment, funding rates have dipped into negative territory.
A negative funding rate means that short positions are growing compared to long positions. It may mean that bearish sentiment prevails among derivative contract holders.
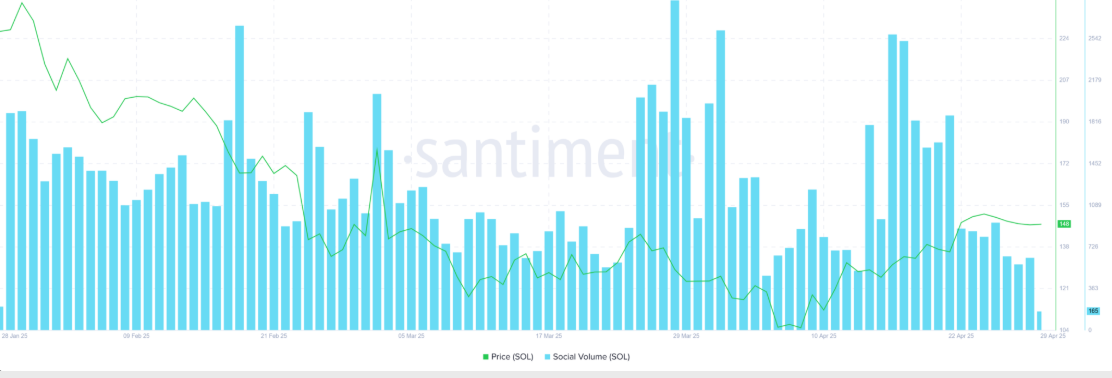
Furthermore, social volume data by Santiment indicated lower sentiment and discussion about Solana. Social volumes have decreased to 165 from an earlier high of 2,579 in mid this month.
Past trends have suggested that lower social activity levels result in a diminished retail role and less active price fluctuation.
Meanwhile, recent analysis showed SOL trading at $151.09. Solana price surged 8.6% over the past week, nearing a market cap of $80 Billion.
SOL could challenge key resistance levels if momentum persists and liquidity growth aligns with macro trends. Analysts predict it may target $300 by mid-2025, signaling strong potential.
Disclaimer
In this article, the views, and opinions stated by the author, or any people named are for informational purposes only, and they don’t establish the investment, financial, or any other advice. Trading or investing in cryptocurrency assets comes with a risk of financial loss.




