
 Bitcoin
 Pearl
Pearl Starknet
 Zerebro
 NEAR Protocol
 Solana
 Quantus

Key Insights:
- Ethereum rallies 29% as short sellers liquidated.
- ETF outflows persist despite price breakout.
- Spot investors drive gains; futures stay neutral.
Ethereum price surged 45% in three days, nearing $2,600. With 6.6 million holders close to profit and $786M in shorts at risk, a $3,000 breakout could come next.
Ethereum Price Rallies Past $2,500 Amid Bullish Pattern Breakout
Ethereum (ETH) recorded its strongest weekly rally since Dec. 2020, climbing from $1,807 on May 7 to a local high of $2,584 by May 10. The 45% surge formed a rare triple white soldier pattern on daily charts, often interpreted as a bullish reversal setup.
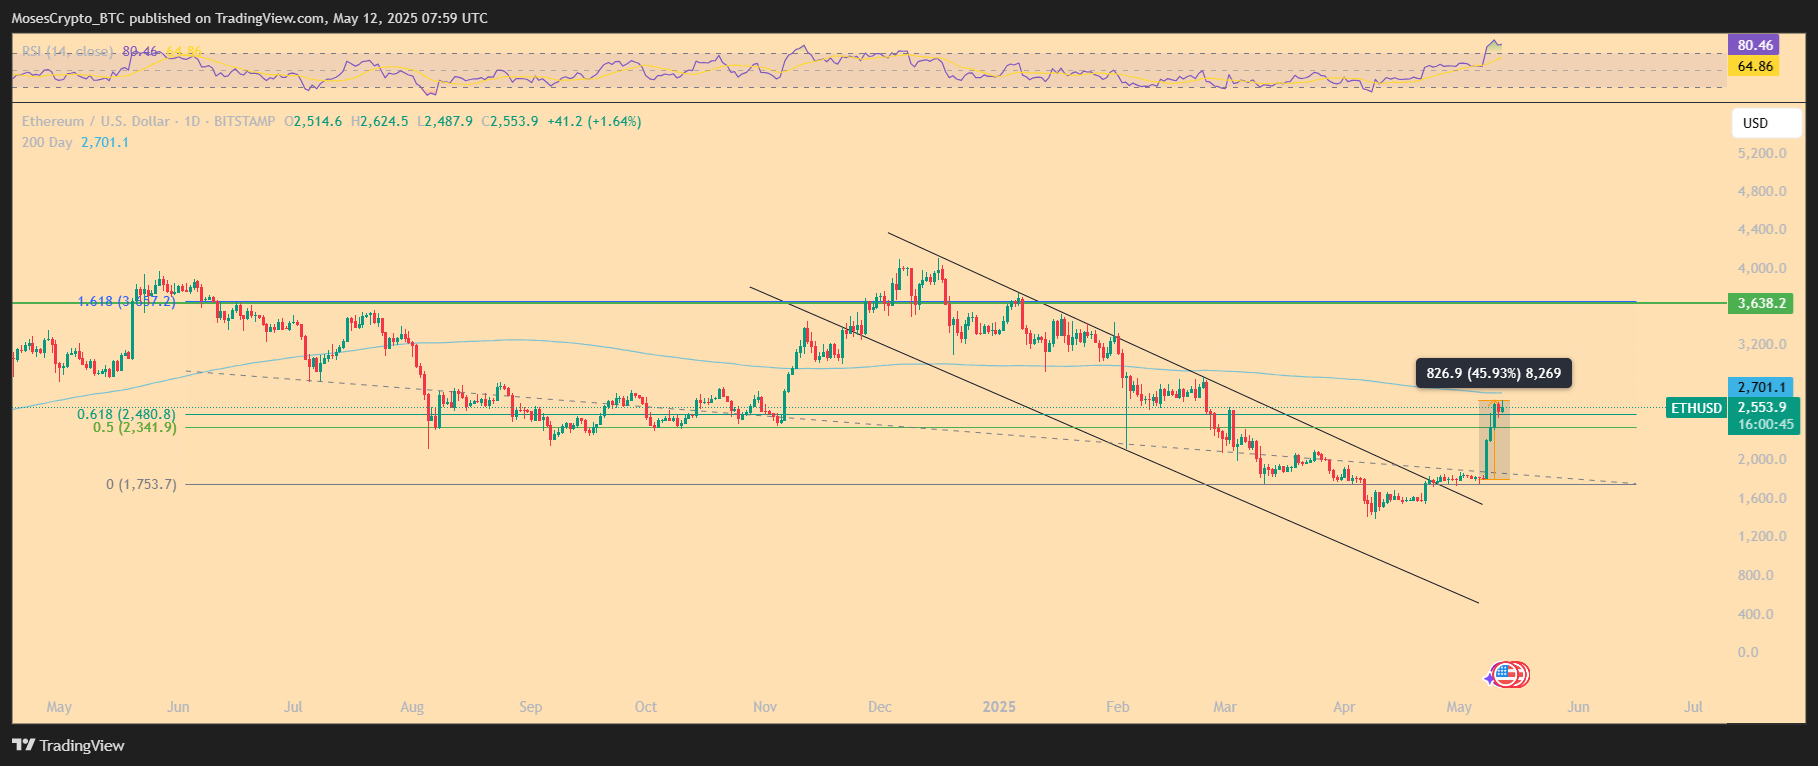
The price jump also completed a rounding bottom formation, signaling a longer-term trend reversal. Analysts now see the breakout level at $2,500 as a critical pivot, with potential upside toward $4,570, based on the depth of the “U” pattern.
ETH has now reclaimed territory above both its 200-day Exponential Moving Average (EMA) and the realized price for accumulating addresses, set around $1,900. This technical rebound coincides with heightened whale accumulation and a liquidation setup that could push Ethereum to new yearly highs.
6.6M ETH Holders Near Profit as Shorts Face $786M Risk
IntoTheBlock data shows that 6.61 million Ethereum holders—owning roughly 66.96 million ETH—are close to breaking even. Their average purchase price lies between $2,360 and $2,557, and the current uptrend places them on the verge of profitability.
Crossing this threshold could form a strong support zone, further reinforcing bullish momentum.
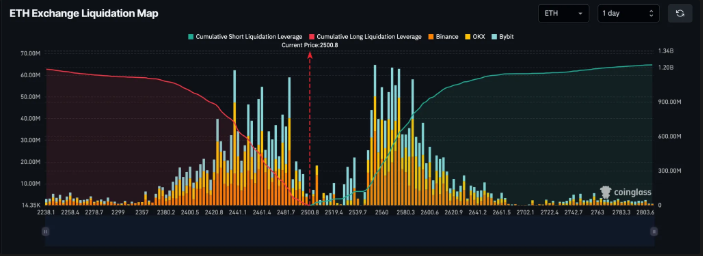
At the same time, Coinglass data highlights a mounting risk of a short squeeze. Ethereum bears face potential liquidations worth $786 million if the price moves another 3% higher, to around $2,586. In contrast, bulls risk $715 million in long liquidations if ETH dips to $2,438.
This tight liquidation band sets the stage for high volatility in the short term.
Open Interest Soars as Market Eyes Derivatives Activity
Ethereum futures open interest (OI) surged from $21.3 billion to $30.4 billion between May 8 and May 11, nearing its record high of $32 billion. The sharp rise reflects increased trader participation and growing leverage in the market.
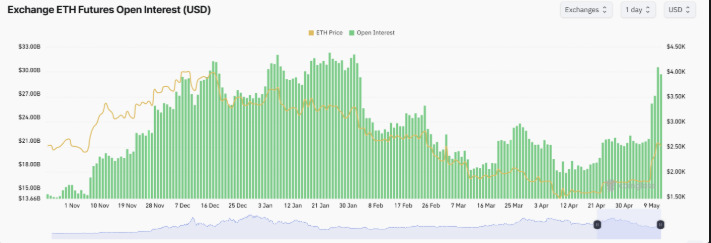
Much of the spot and derivatives activity appears concentrated on Binance, the most active exchange for ETH during this rally, according to CryptoQuant. The uptick in outflows from exchanges also suggests accumulation behavior among large holders.
Meanwhile, the taker buy-sell ratio—a key futures sentiment gauge—dropped below 1 on May 10, signaling that short-term bearish bets may be rising. A ratio below 1 suggests sell volume exceeds buy volume among takers in perpetual swaps.
Peter Brandt Points to Breakout Despite Bearish Setup
Veteran trader Peter Brandt shared his analysis on X, suggesting that ETH might be on the verge of a bullish breakout. While Brandt identified a rising wedge—a traditionally bearish formation—he noted that a decisive move above the upper resistance line could propel ETH toward $3,800 to $4,800.
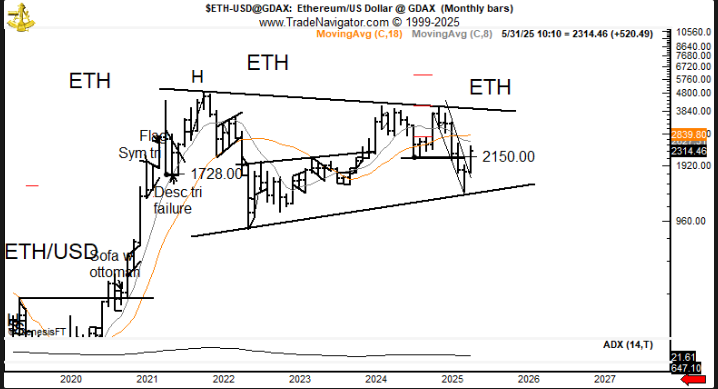
This marks a change in his earlier bearish stance on Ethereum. The revised outlook aligns with the broader sentiment shift as ETH regains its bullish structure above multi-month resistance zones.
Brandt’s target range overlaps with bullish technical projections derived from the rounding bottom breakout, strengthening the case for continued upside.
ETH Whale Turns $21M Loss into $104M Holding
Adding fuel to bullish speculation, on-chain sleuth Crypto Rover highlighted a whale wallet that turned a $21 million loss into a $21.7 million profit by consistently buying the dip. The address now holds over 50,165 ETH, worth $104.5 million at press time.
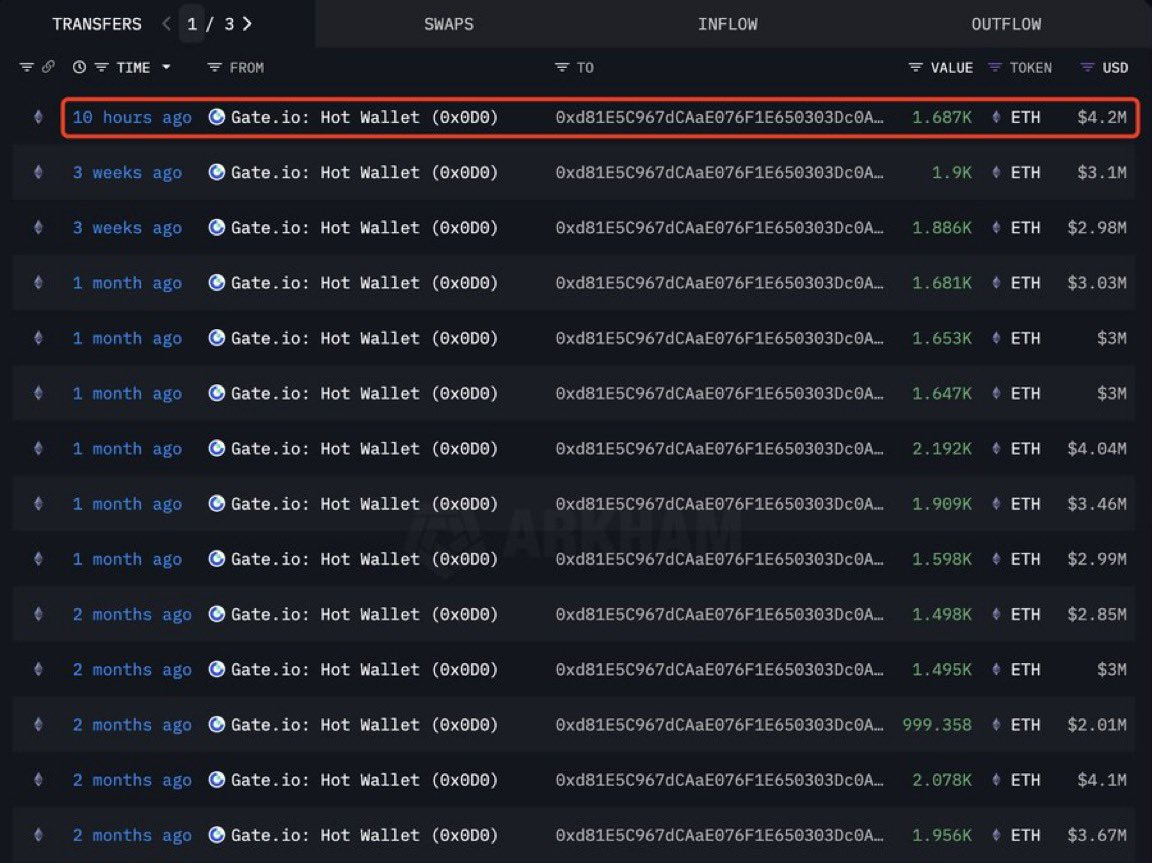
This wallet activity may hint at institutional or high-net-worth conviction, often viewed as a leading indicator for retail sentiment.
Additionally, Ethereum surpassed its realized price for long-term holders and institutional wallets. The reclaimed levels mark a psychological milestone, indicating a return to profitability and increased confidence.
Caution Ahead as RSI Warns of Overheating
Ethereum’s Relative Strength Index (RSI) has entered the overbought zone despite bullish setups. Historically, this signals overheated conditions, often preceding short-term corrections.
Fibonacci retracement analysis shows that ETH has now tested the 0.5 to 0.618 zone, commonly seen as a resistance band during trend recoveries. A temporary consolidation below $2,500 could be on the cards before any further move toward $3,000 or higher.
As always, market participants remain split—some anticipating a continued parabolic breakout, others watching for a pullback as leverage builds and RSI overheats.
Disclaimer
This article is for informational purposes only and provides no financial, investment, or other advice. The author or any people mentioned in this article are not responsible for any financial loss that may occur from investing in or trading. Please do your research before making any financial decisions.



