
 no crying in the casino
 Pyth Network
 NEAR Protocol
 Starknet
 Quantus
 Pearl
Pearl Bitcoin

Key Insights:
- $3B in short positions risk liquidation above $110K.
- RSI divergence signals weakening momentum near resistance.
- Parallel channel caps Bitcoin’s push toward a new all-time high.
Bitcoin price hovered near $107,000 on May 21, showing signs of pressure at key resistance levels. The price remained stuck below $109,676 despite bullish momentum building through May.
At the same time, over $3 Billion in shorts hovered above $110,000. Traders watched for a potential liquidation cascade if BTC breaches the resistance zone near its all-time high.
$3B in Short Positions Could Fuel Rally for Bitcoin price to New Highs
Data from liquidation heatmaps showed high-leverage shorts above $110,000. A breach may trigger forced buybacks worth billions.
Axel Adler Jr. compared the current setup to 2017’s bull run. Back then, Bitcoin price rose from $1,000 to $20,000 post-halving.
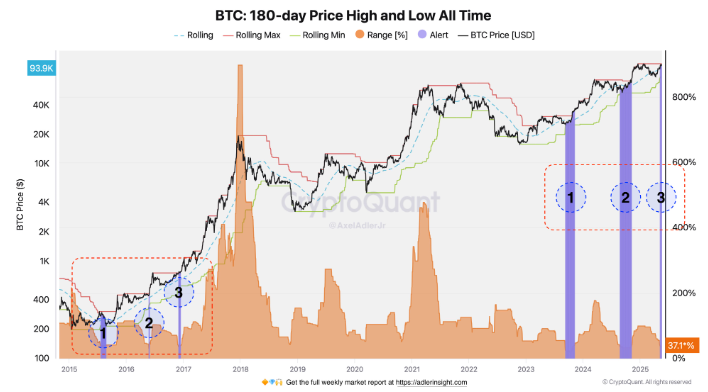
He highlighted a third 180-day price compression forming in 2025. Historical patterns show this often precedes a breakout.
According to Adler, liquidating $3 Billion in shorts only needs a move past $110K. Bulls might target that level next.
The reverse scenario—liquidating longs—would require a steep drop to $94,612. This suggests downside risk is less immediate for now.
Bitcoin Price Technical Compression Mirrors Previous Breakouts
Bollinger Bands also support this compression narrative. The bands tightened on daily charts, indicating reduced volatility. Historically, that leads to strong moves.
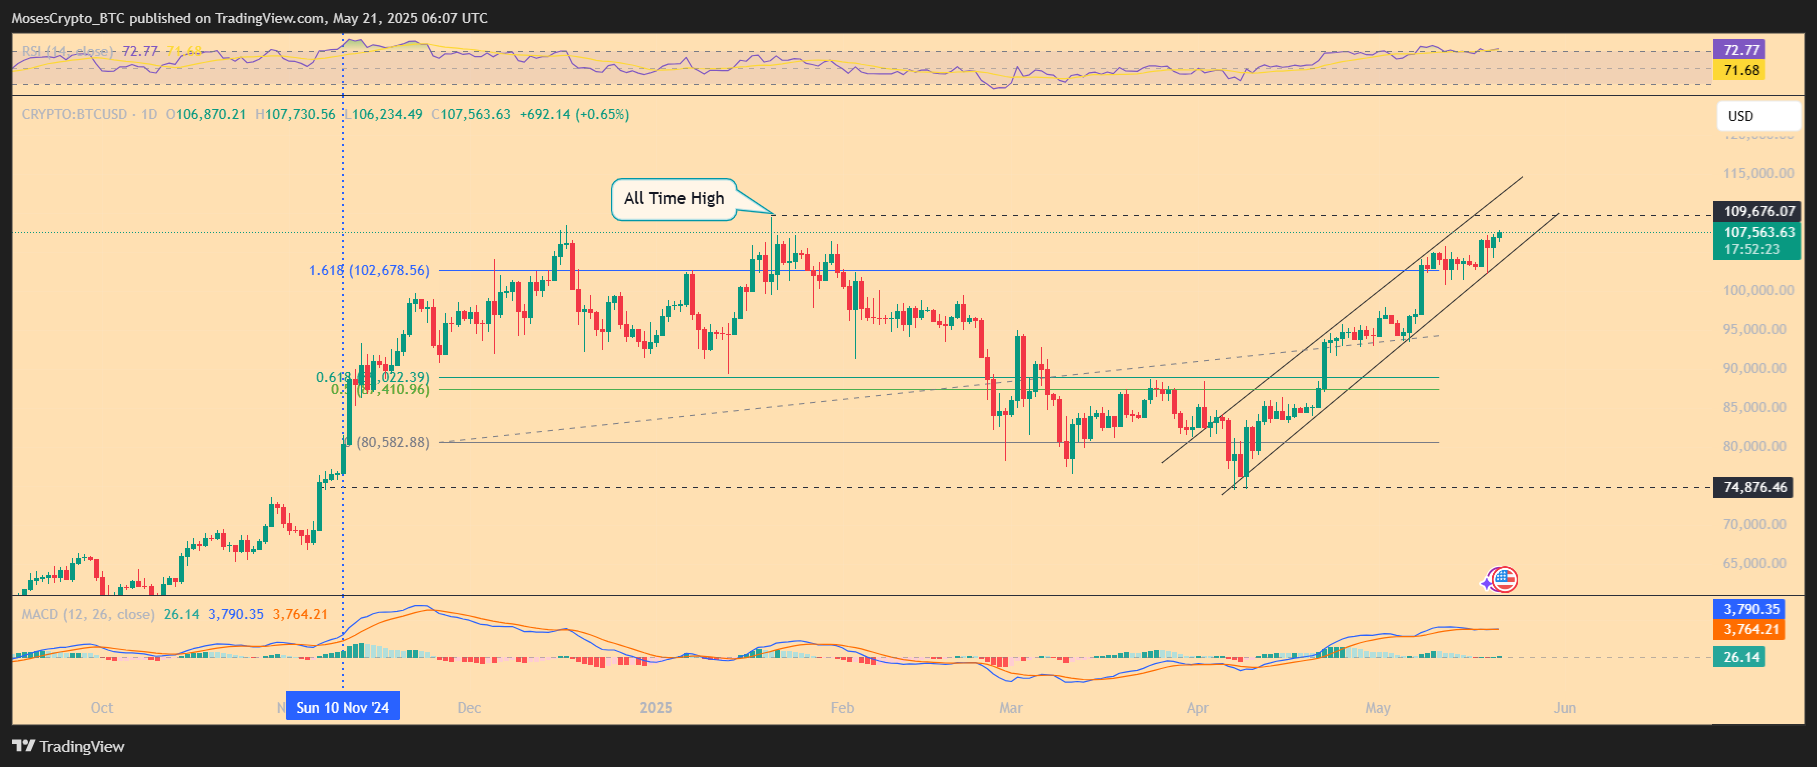
Since April, the Bitcoin price has traded in an ascending channel. Price respected the range, forming steadily higher highs and lows.
The top of that channel is now near $109,676. That aligns with key resistance and previous rejection zones. If broken, BTC could enter price discovery.
Van Lagen wrote on X, “A liquidation magnet is glowing above $107K.” He believes shorts will soon face a squeeze.
Bearish Divergences Signal Caution on RSI and MACD
Analyst Ali Martinez warned of momentum loss on the daily chart. “No bullish breakout yet,” he noted on May 20.
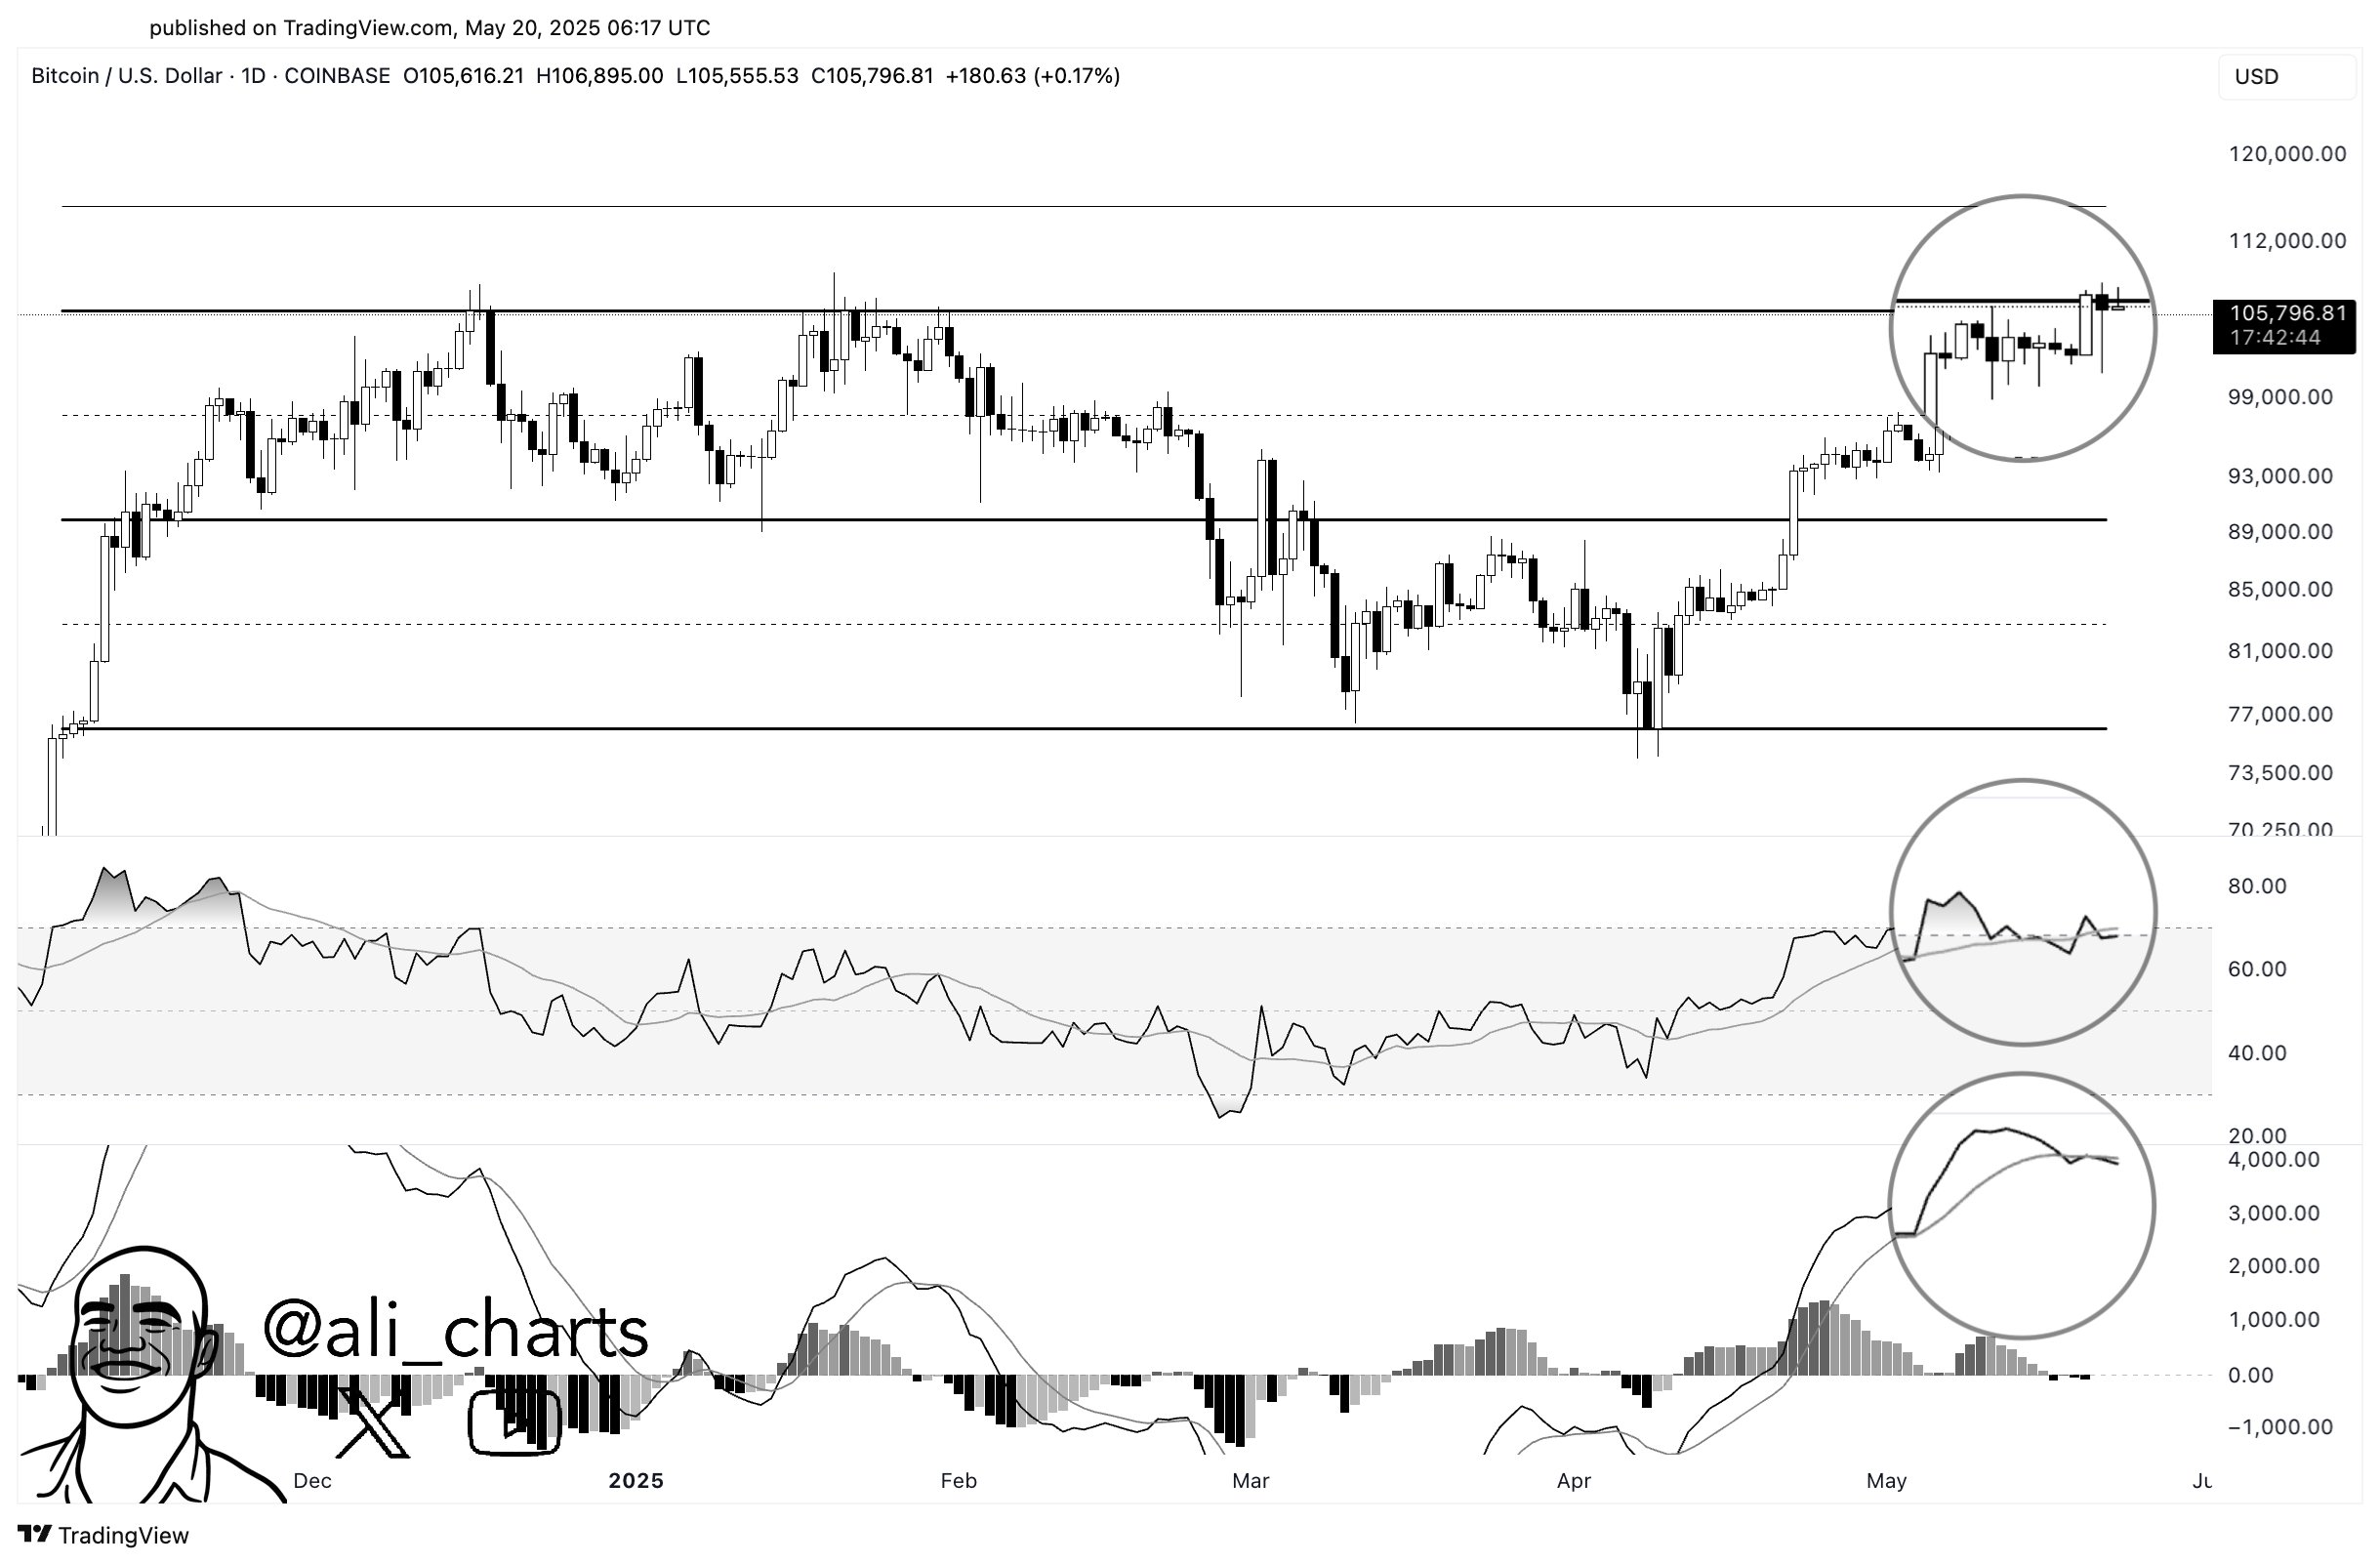
Martinez highlighted a divergence between price and the Relative Strength Index (RSI). RSI peaked early in May but failed to climb in price.
That divergence suggests weakening buying strength. At press time, RSI hovered at 72.48—just above the overbought threshold.
The risk is that bullish momentum could stall. Martinez warned that previous divergences led to sharp pullbacks in past cycles.
He flagged a bearish crossover on the MACD. The MACD line dropped below the signal line, signaling weakness.
Parallel Channel Resistance Remains Stubborn Obstacle
Martinez pointed to a longer-term parallel channel still capping upside moves. The upper trendline aligns near current prices.
Bitcoin has faced rejection here before. “Every retest saw price pull back,” Martinez added. “This one could repeat that behavior.”
A breakout above the channel is needed for fresh bullish confirmation. Until then, structure remains intact—but fragile.
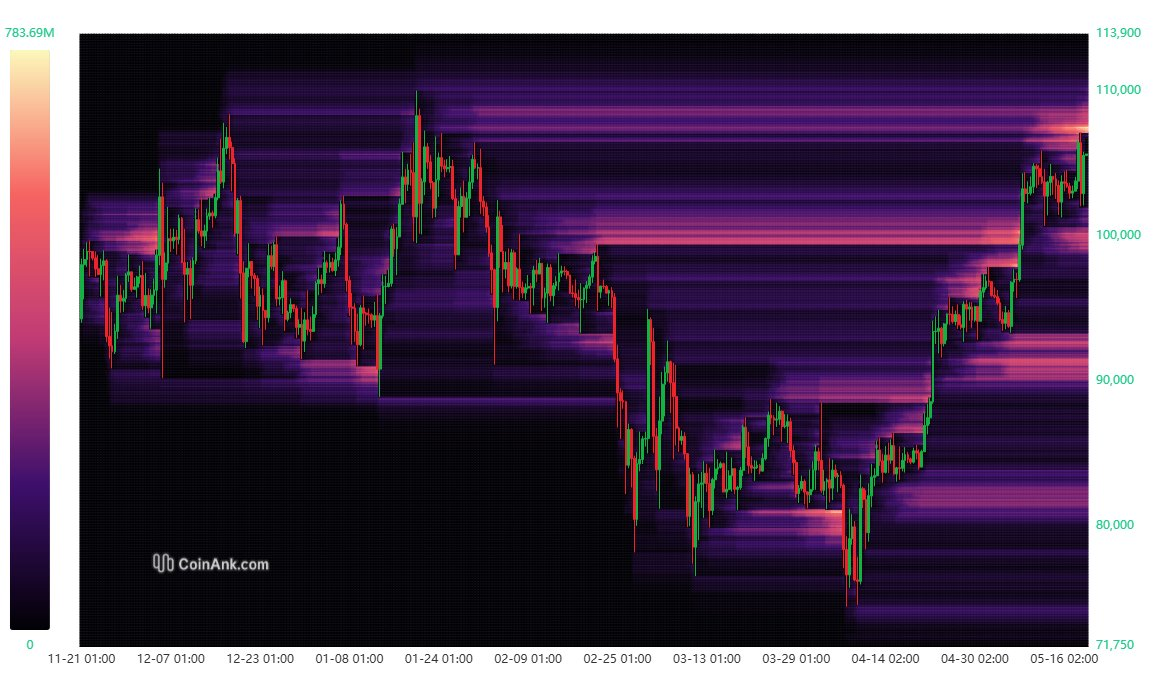
Gert van Lagen remains bullish. “A liquidation magnet glows above $107K,” he posted. “BTC soared on fear. Now it rises on liquidations.” As sell-side liquidity thins out, Van Lagen expects forced short covers to fuel the next push.
ETF Inflows Add Confusion, Not Clarity
While ETF inflows remain strong, not all analysts see this as bullish. Daan Crypto Trades offered a counterpoint on X.
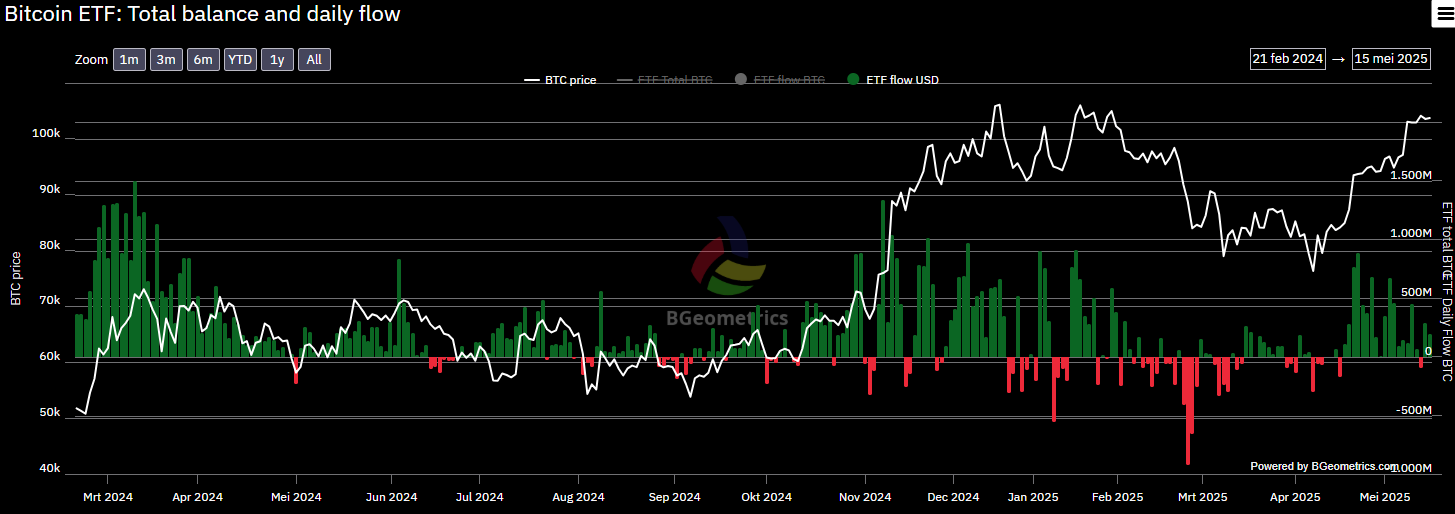
He explained that big buyers use ETF flows to accumulate, but rallies stall if there’s no follow-through. The inverse is true during outflows.
When prices don’t drop despite heavy withdrawals, it shows resilience, not weakness. Bitcoin price showed signs of both at press time, making ETF flow signals harder to trust.
Next Move Hinges on $109K Breakout or Rejection
Bitcoin price now trades at a central decision zone. Bulls need to clear $109,676 and trigger liquidation pressure above $110,000.
A breakout could ignite a wave of forced buying, pushing BTC toward new all-time highs. Volume would likely spike. But RSI and MACD divergences raise doubts. If bears reclaim momentum, a return toward $94K support remains possible.
Disclaimer
In this article, the views and opinions stated by the author or any people named are for informational purposes only, and they don’t establish investment, financial, or any other advice. Trading or investing in cryptocurrency assets comes with a risk of monetary loss.


