Walrus
 Quantus
 Pudgy Penguins
 Bitway
 Quant
Quant Sui
Sui Bitcoin

Key Insights:
- Tether-linked wallet moved 1,650 BTC to Binance since Bitcoin crossed $100K.
- Wall sits at $106K, and the next major test is around $110K–$112K.
- BTC is nearing a breakout from a descending channel pattern.
Bitcoin price is on the verge of a pivotal move as three major market signals converge. A $100 million whale deposit to Binance, a towering sell wall at $106,000, and a descending channel pattern have placed Bitcoin at the center of intense technical and on-chain scrutiny. As volatility declines and market sentiment changes, analysts predict a price rally soon.
Whale Transfer Sparks Concern as Bitcoin Price Reacts
Lookonchain has revealed that a single whale deposited over $100 million worth of Bitcoin to Binance using multiple new wallets. The transfer quickly grabbed attention from the market, given that big whale movements often happen before a change in volatility or main trends.
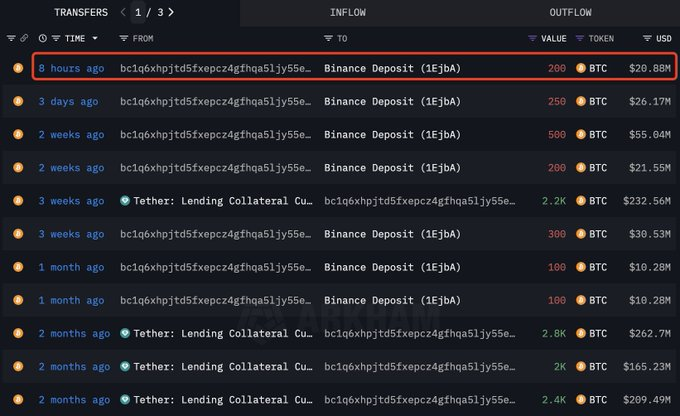
Such whale activity often introduces uncertainty among retail investors. Fear of a sudden sell-off leads traders to hold onto their positions, which makes the market move slowly. Although traders initially panic, certain analysts think these struggles could be a strategy to drive away weaker traders just before prices reverse.
This aligns with historic market trends, where large players create temporary price dips to acquire Bitcoin at discounted levels.
Meanwhile, analysts are now observing whether this transfer leads to selling or prepares the way for a large amount of accumulation. As it stands, Bitcoin price remains pinned below key resistance but continues to consolidate above crucial support levels.
Bitcoin Sell Wall at $106K Could Define Next Bullish Phase
According to technical analyst CW, there is a large sell wall centered around the $106,000 level. As a result of this formation, sellers are often unable to push prices higher because they want to sell large quantities.
However, if the current consolidation phase propels Bitcoin price through this level, the implications could be substantial.
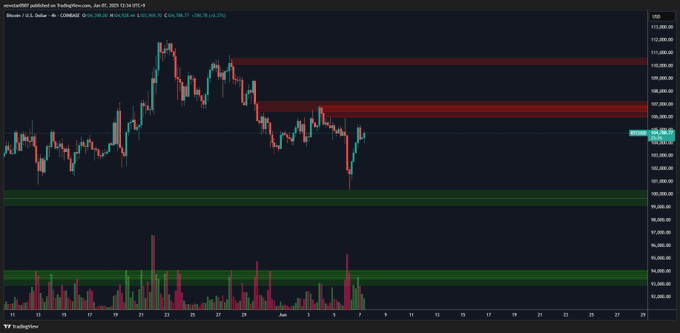
According to the analyst, resistance between $106,000 and $110,000 is not likely to be high. This wide price gap is significant since it has historically experienced less trading activity. If bulls break above the sell wall, there is a chance that the price will surge quickly since few traders are selling now.
Descending Channel Structure Builds Case for Breakout
Furthermore, Clifton Fx shared a 4-hour Bitcoin chart featuring a well-defined descending channel. This pattern revealed that prices were between two sloping lines that got closer over time. Usually, these formations lead up to a solid rise in the market.
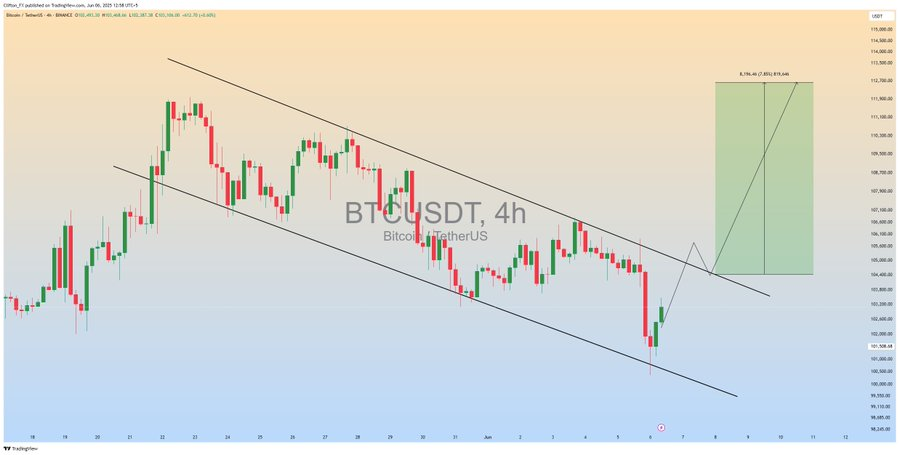
For a long period, the lower edge of the channel has not been broken and has served as support. On the other hand, the upper limit of the channel regularly capped rallies. Bitcoin price is now approaching the upper trendline, with growing momentum indicating a potential breakout.
If the support level is broken, Clifton Fx aims for $120,000 with the support of Fibonacci retracement points and earlier resistance levels.
This BTC price pattern gives bulls a clear technical framework. Failure to rise above could bring the price back down to $66,000. However with bullish signs becoming stronger, the chances of BTC price continuing up are increasing. The connection of this pattern to whale transfers and significant resistance zones means it is very important for the coming months.
Technical Indicators Signal Volatility in Bitcoin Price
According to the 4-hour chart, Relative Strength Index is around 50, and this means investors are between neutral and bearish. However, RSI has been going up from its lower ranges, which indicates new buyer activity. A move above 60 would confirm short-term bullish momentum.
Meanwhile, the Moving Average Convergence Divergence (MACD) indicator is currently showing a bullish crossover. This crossover, in combination with the current trend, makes it clear that there is a possibility for a breakout in the market.
Bollinger Bands are narrowing as the market gets less volatile, which is often followed by a strong move in prices. Once the bands line up, this signals that the consolidation in the descending channel is almost done. This suggests bulls are starting to accumulate in preparation for a bullish Bitcoin price move.
Disclaimer
In this article, the views and opinions stated by the author or any people named are for informational purposes only. And they don’t establish the investment, financial, or any other advice. Trading or investing in cryptocurrency assets comes with a risk of financial loss.